Getting Started
Getting Started
Create Analysis
Log in to the system (https://biosys.bgi.com/) with the email account you received the notification with to create a new analysis plan.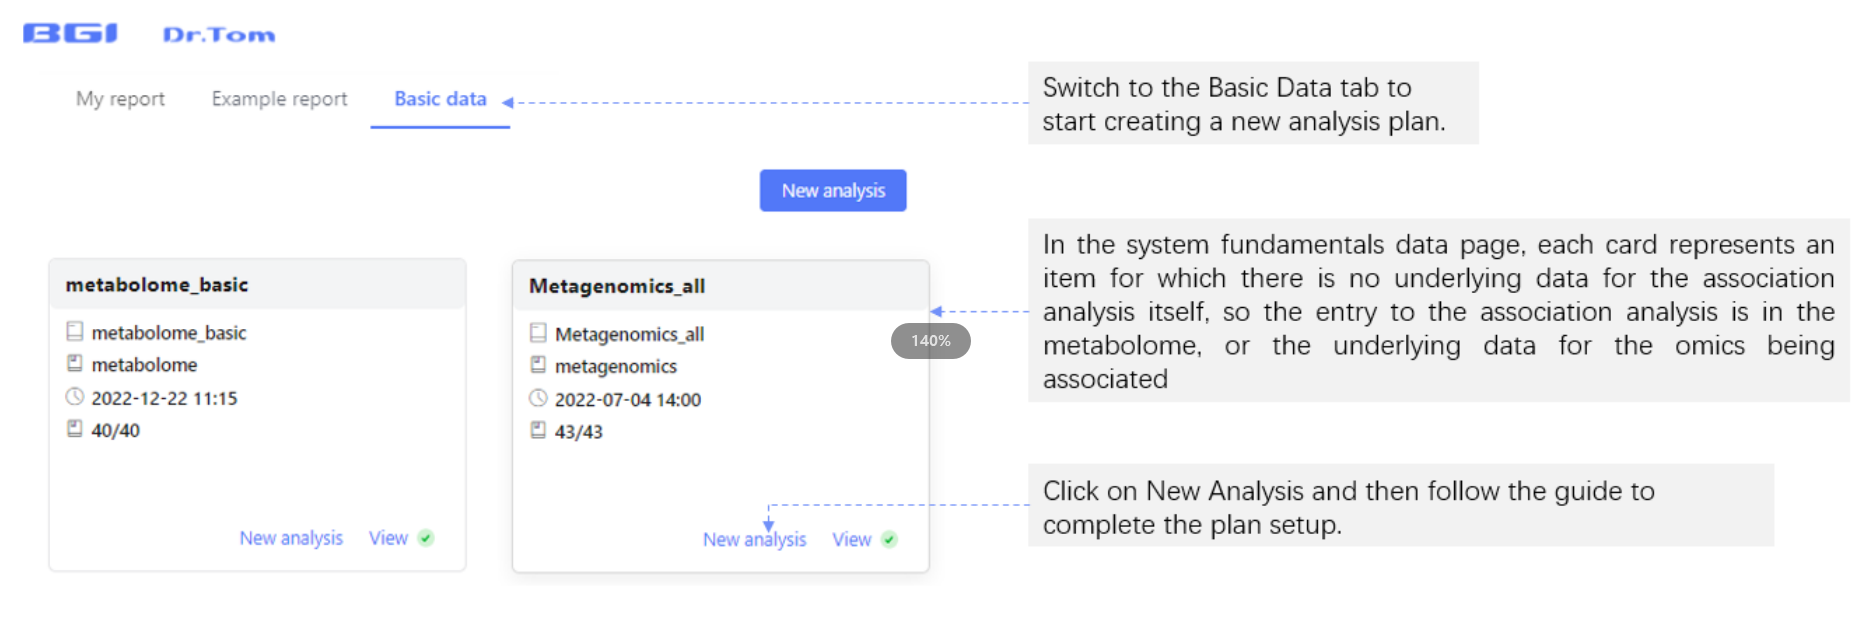
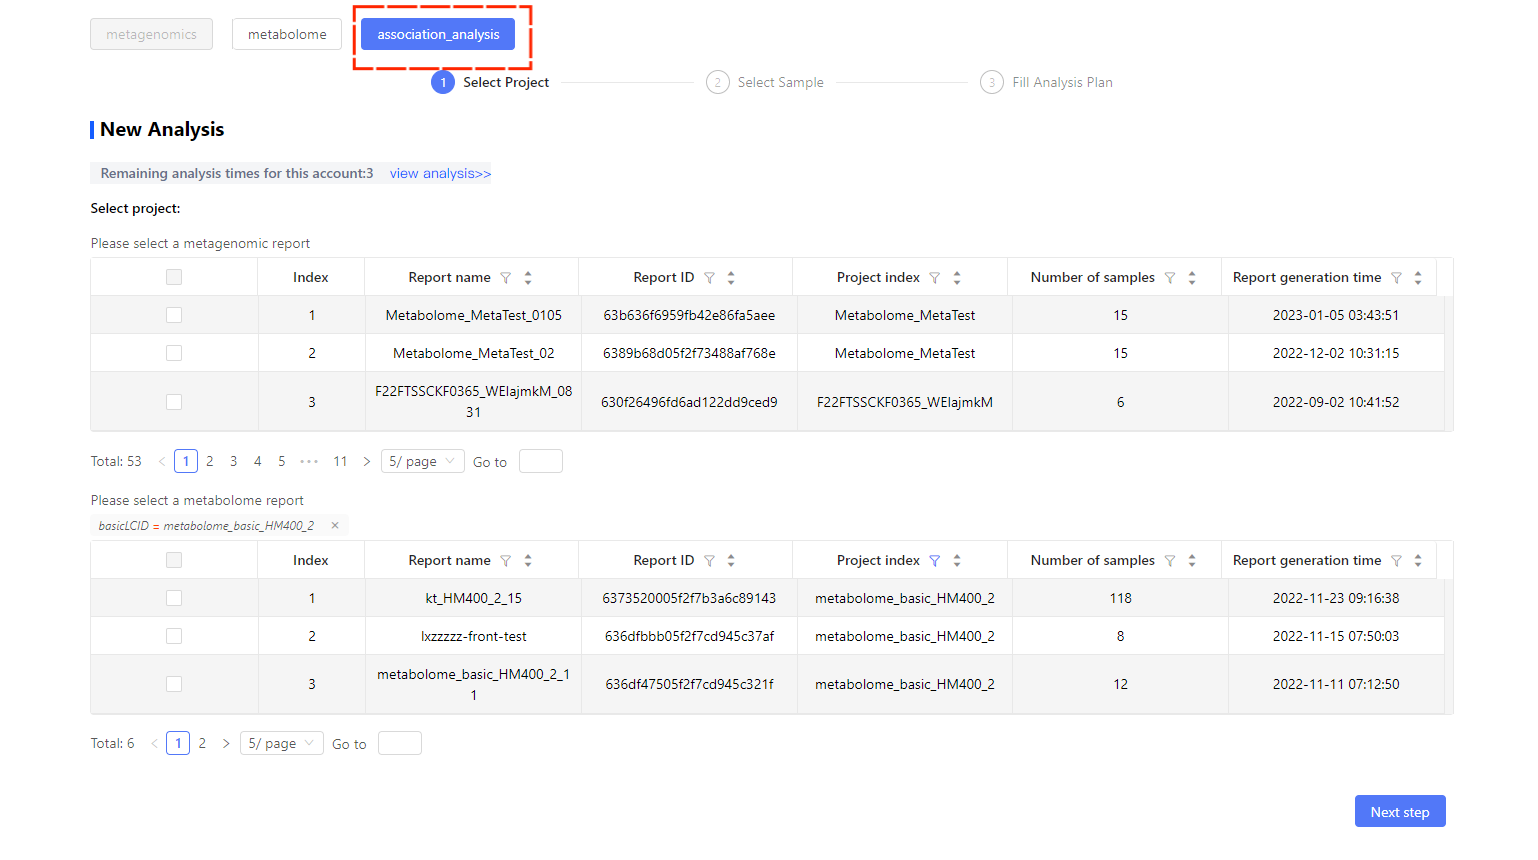
Selecting an association analysis above the new analysis page, and setting the protocol as suggested by the system, i.e. submitting an association analysis.
Note
A metabolome report and a metagenome report need to be present in your account number simultaneously to enable new association analysis protocols.
View Results
After completing the analysis plan, Dr. Tom will go through the analysis process according to your configurations and you will receive an email notification when this is completed. You can then log in to the system with the email address with which you received the notification, and find and view the analysis results in My Analysis.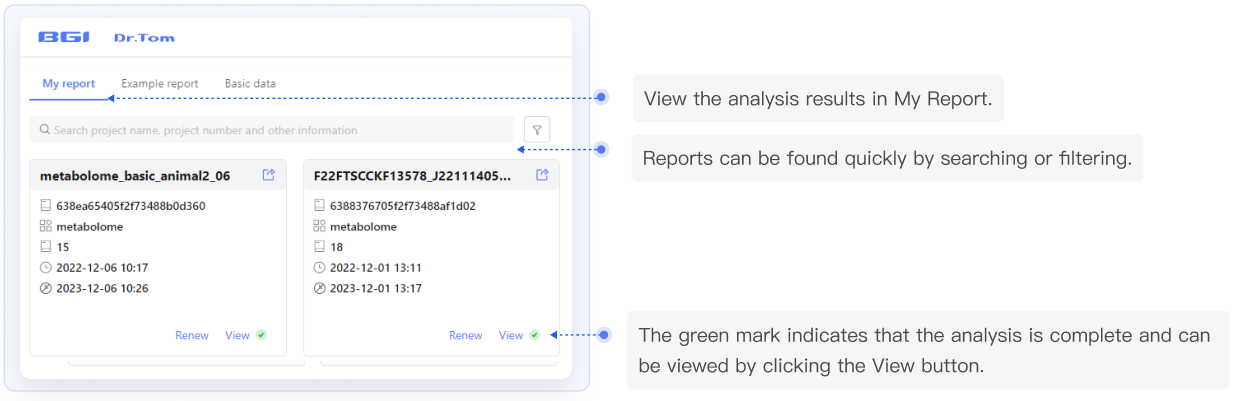
On the View Results page, you can view the plotted data, view and download all figures of the current analysis, view the intermediate analysis data, edit the figures, and filter the data to redraw figures. 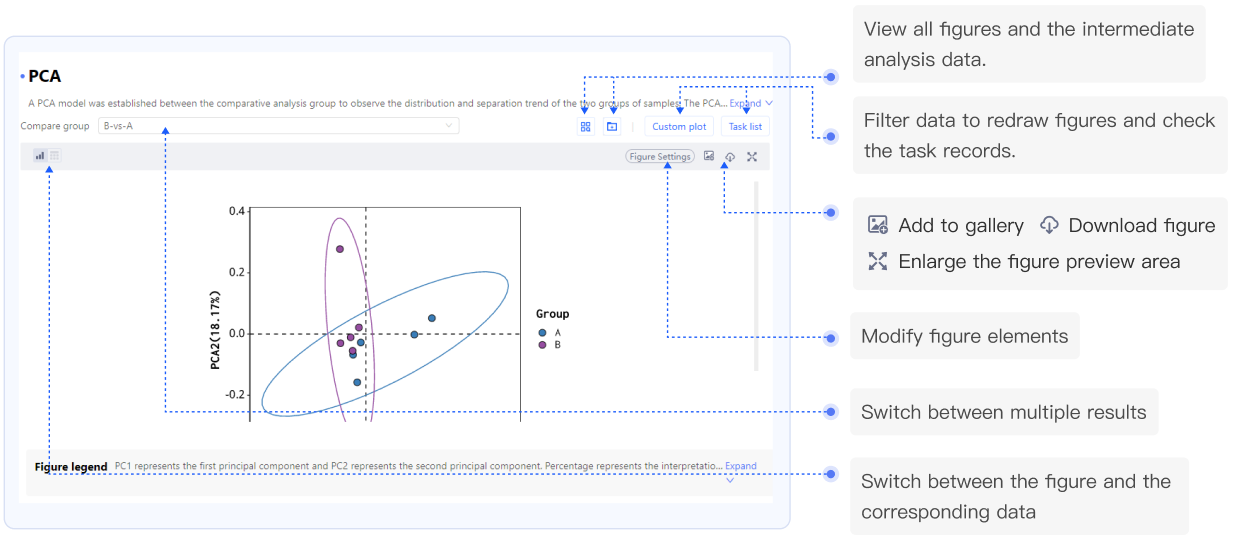
Figure settings
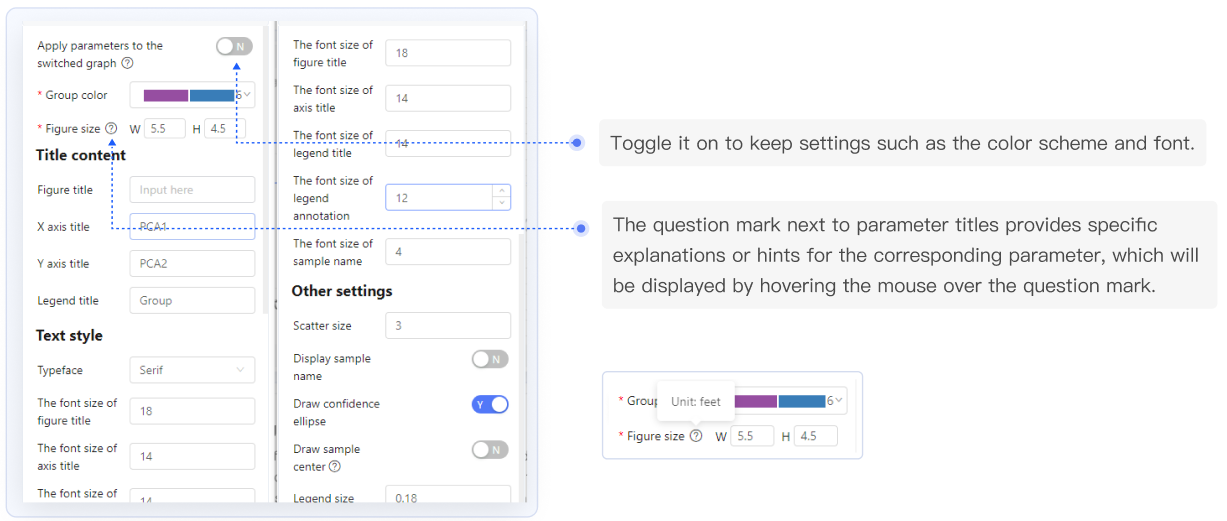
You can make adjustments to most of the figures (if the Figure Settings button is usable), including adjusting the presence, size, and color of elements in the figure.
All changes you make to the figure are for the current analysis only. Turn on the Apply Parameters to Later Figures toggle button if you need to keep settings such as the color scheme and font.
Draw Figures After Data Modification
Modifying figure settings only changes the style and presentation of the figure, while the custom drawing function filters and shapes the data according to your settings and uses the default figure settings, the color scheme and group settings specified in the plan to draw figures. Custom drawing results can be viewed in the Task List.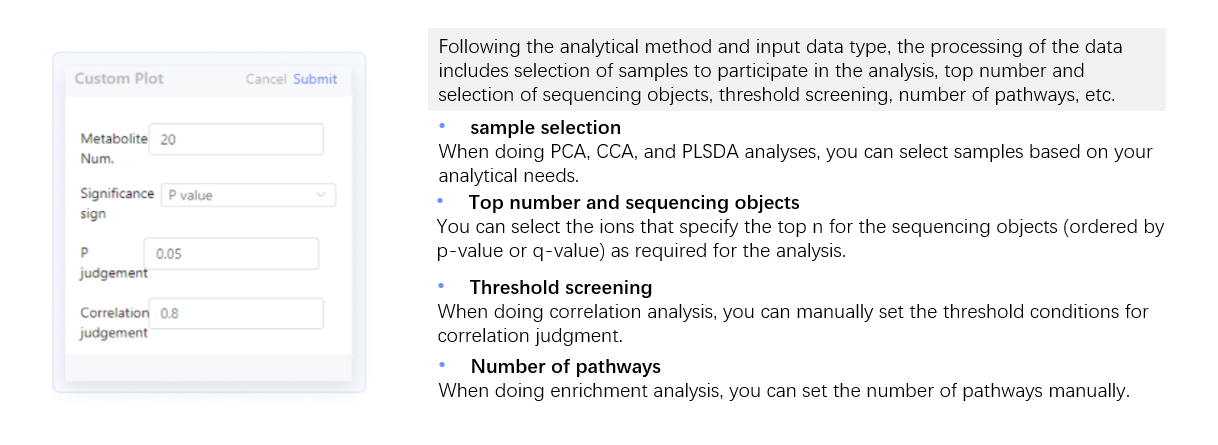
The analysis result page with a right-hand table provides a richer interactive experience. When you select a selectable area of the figure, the table on the right will automatically display the data contained in that area. You can also manually filter the data and click the Analyze button, select any of the available mini-tools to submit the data you filtered for analysis, and view the results in My Analysis.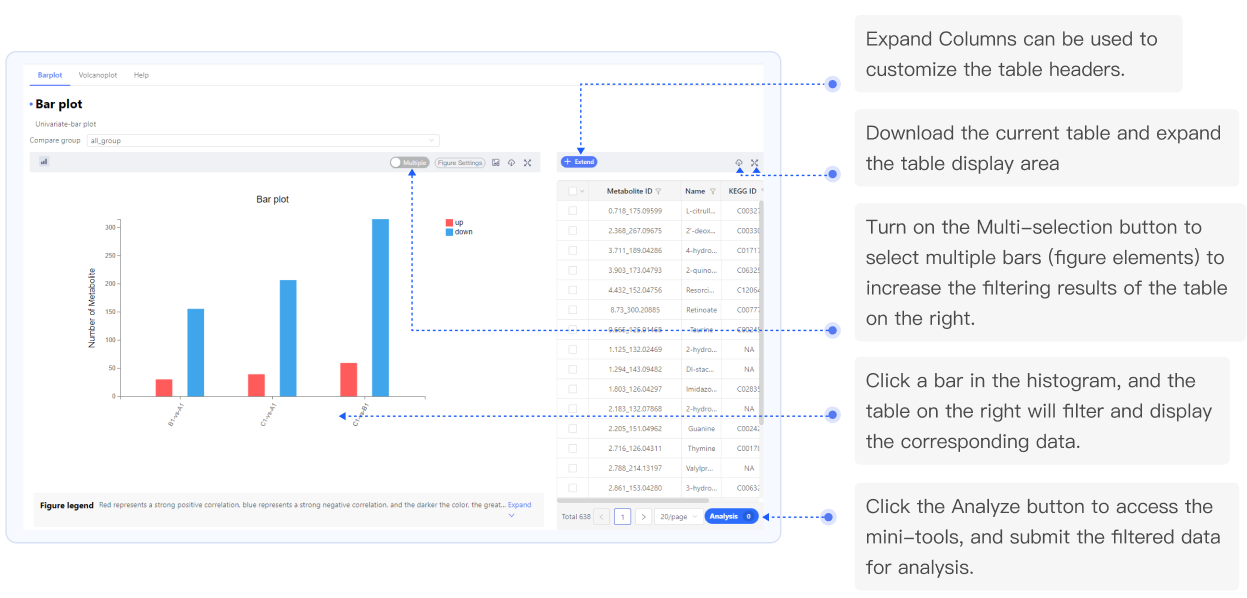
Download Results
The system provides downloads of the analysis results (zip) and PDF reports. You can download them from the top of any report page.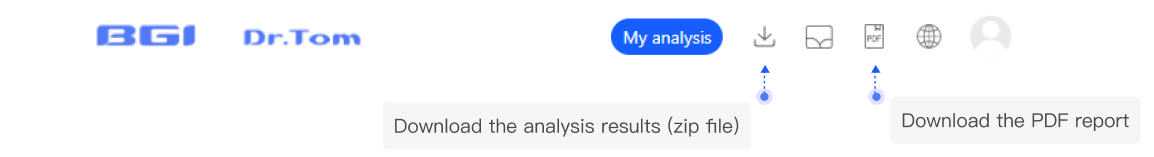
Notes
- For a better experience, please use this system on a 14'' or larger screen.
- If you have any doubts about the analysis method and the meaning of the analysis results, you can search directly by pressing Ctrl + F on the analysis point's help page/system help page and entering the keywords.
- More detailed instructions for using the system can be found in the report at Help - User Manual or in the Metabolome Help System (https://biosys.bgi.com/help/en/association/).