Manual
Manual
Manual
Core Terminology
Basic Data:Gene abundance tables, species abundance tables and functional abundance tables, QC results, sample information, identification tables and peak intensity tables generated based on rawdata (sequencing machine data or mass spectrometry machine data) are referred to as the base data, and the base data are the basis of the systematic analysis by Dr.Tom.
Analysis Scheme:The data of two single omics to the result of association analysis, which requires you to fill in and confirm the sample correspondence as well as the necessary analytical parameters, is called the analytical protocol.
Analysis Process:The analysis process is called Process for short. It refers to the process of standardized analysis according to the analysis scheme you filled in. The results of this step will be presented in your report.
Reports:Reports classify some or all of the results of an analysis under certain rules, organize them together, and can be viewed on a web page or PDF.
Figure Switch:After filling in the analysis scheme, the system will analyze each analysis point according to the scheme you set. Multiple results may be generated according to different grouping and/or other parameters. Switch the analysis parameters on the result page to call up the analysis process analysis result, which is called Figure Switch.
Picture Settings:For the picture drawn by the process, if you need to make some adjustments, you can click the result page picture settings to set the current picture. The picture settings generally do not modify the data required for drawing pictures.
Custom Plotting:On the analysis result page, if you have an analysis that is not involved in the process, you can click Custom Plotting. The custom plot will filter the data according to your requirements, and plot with the graph settings preset in the scheme.
Small tool:The small tool works as well as custom plots to screen data for re plotting, with the difference that the small tool provides a greater degree of freedom in data screening, and you can even screen the data manually.
Create a new analysis in three steps
Association analysis is report as a dimension, and your metabolome underlying data and the omics underlying data being associated, such as metagenomes, must each have at least one report in order to build an association analysis scheme. If no report has been generated in your underlying data, please make a report. Also you will need to have both metabolomic and metagenomic data in your account number to build a new association analysis.
Note
- If you forget your password you will need to reset it before you can logon to the system.
- Three opportunities for association analysis were given to each metabolome profiling result, and the number of association analyses was the same as the number of metabolome runs.
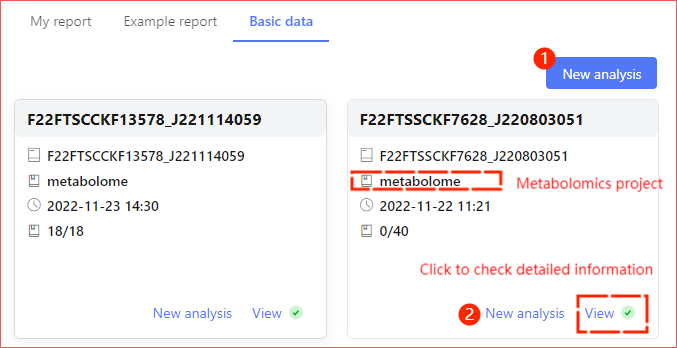
In the system base data page, each card represents one item. Currently, metagenomic and metabolomic projects are systematically supported to establish association analyses.
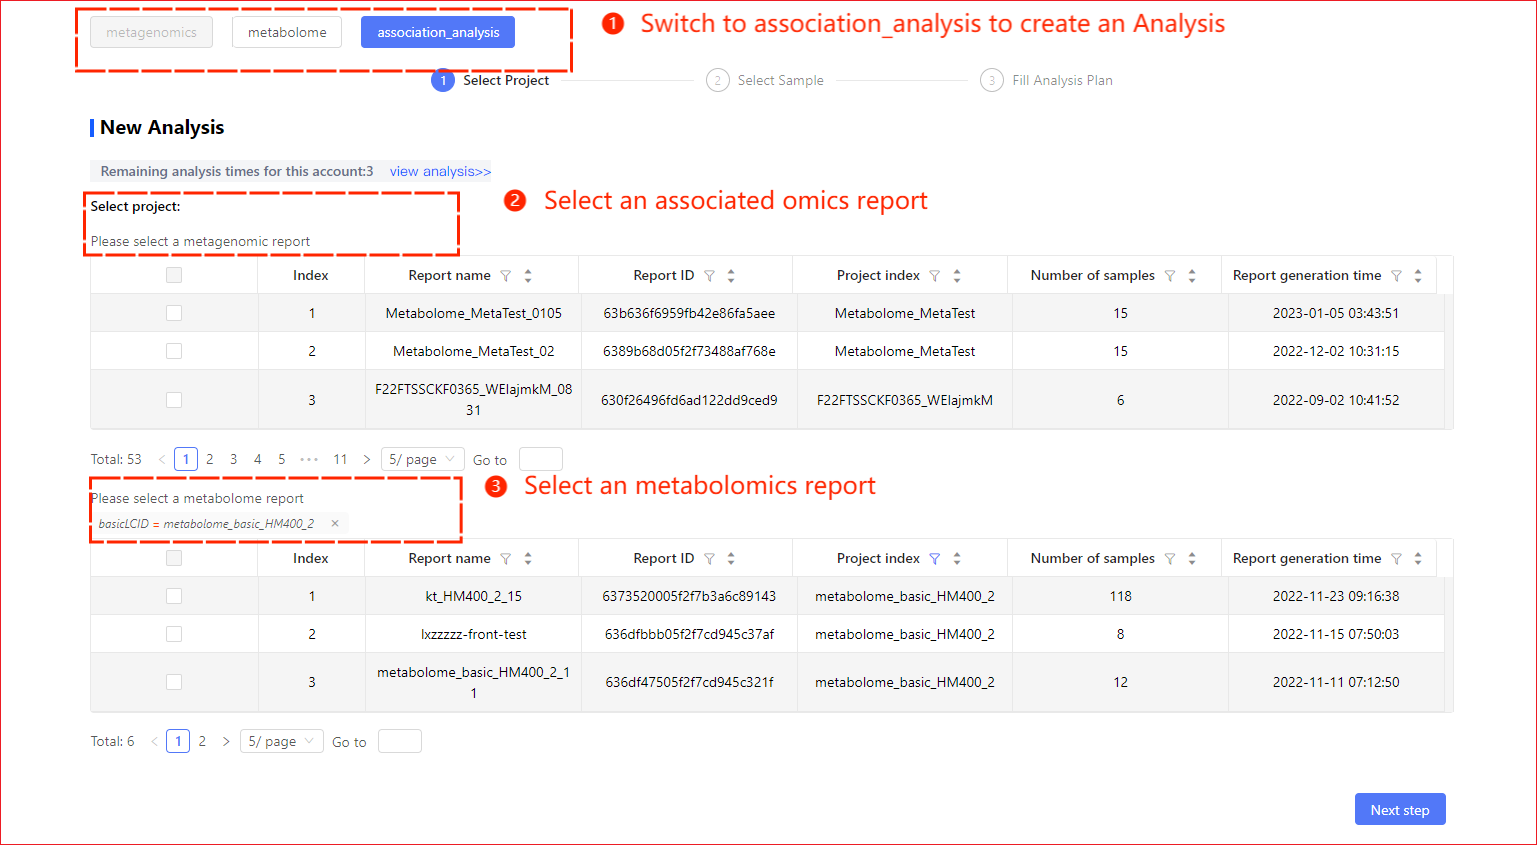
Step 1: Select Projects
Once you enter the new analysis page, click on the uppermost association analysis button to new the association analysis scheme.
Tips
- When newly building the analysis above ①, manual curation of a report of a metagene is required, followed by a report of a metabolome;
- When new analysis is created at upper panel ② a report that you have for the omics underlying data is filtered, your choice is narrowed and another omics report will not have a screening action.
You can also do this by clicking on the funnel or arrow on the table header! [number of mate pairs] (/docimg/MetaBoGenolomics_zh/filter_order.png){.inline-image},screening or sorting to quickly target report.
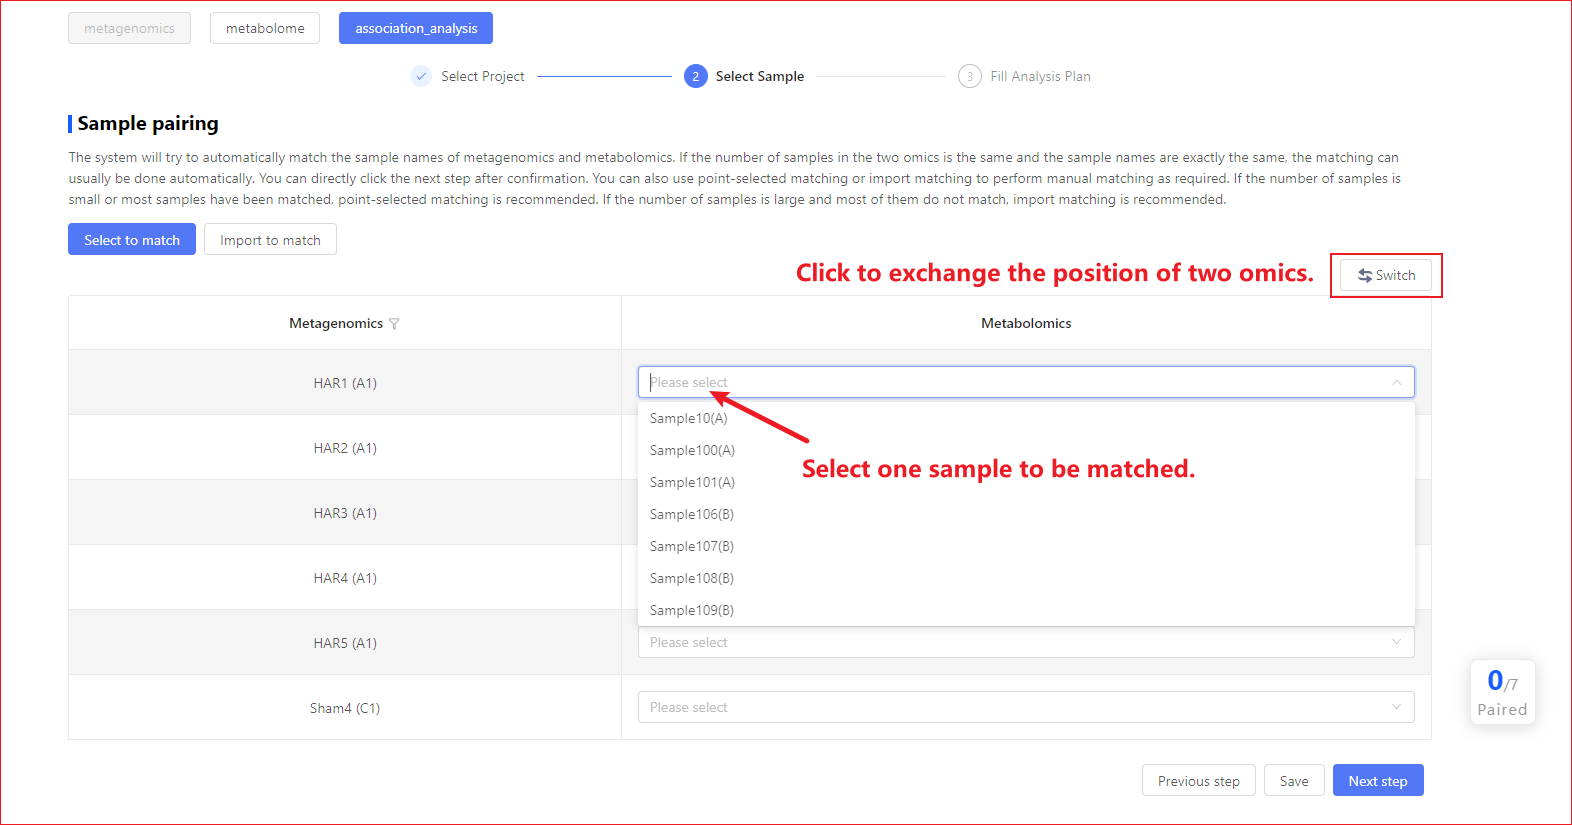
Step 2: Select Samples
Because association analysis involves sample multiomics and (or) multiple batches. For association analysis, you need to pair samples to ensure that the two omics samples that participated in the analysis correspond one-to-one. The system gives you two ways of Sample Pairing:
- Select to match:List select samples in a omics project and select by clicking the corresponding sample name in another omics.
- Import to match:Download the template, fill in one paired sample per line in the template, and upload to the system.
You can select a sample pairing format based on your actual situation, as recommended below:
| Condition | Select to match | Import to match |
|---|---|---|
| 1. You don't have many samples. | √ | |
| 2. Samples' names are already identical. | √ | |
| 3. You have many samples. | √ | |
| 4. You need rename the sample name in the result bulkly. | √ | |
| 5. You want to discard some samples in the current ANALYSIS. | √ |
Tips
- If you need to rename the sample batch, select import match and fill in a new sample name in the third column.
- You can go through the fitted logarithm at the bottom right
 to determine if the number of samples entered into the analysis is what you need / plan for, where the numerator blue bold numbers indicate the number that have been paired, the denominator indicates the number of left omics in dot select matches, and the number of samples for either omics in imported matches.
 - You can staging the current protocol fill, after which it is found in my report, and continue filling in.
Select to match
The system will first attempt an automatic match based on the sample names of the two omics, and if the number of samples is equal in the two omics, the sample names are exactly the same, usually the automated match is good, you check error free and proceed directly to the next step. If the system does not automatically match, or there are automatic matching errors, you will be required to select the sample pairing relationship by manual clicking.
Tips
① Click select and match can be made by swapping buttons! view all figures Omics with few samples were placed on the left to facilitate viewing and comparison; ② Click select and match does not support removing a sample, as you would need to remove part of the sample, select an appropriate report to participate in the association analysis in the first step, or use an imported match;
③ If a sample is paired in a metabolome, all samples within the grouping in which that sample is located should be paired in all.
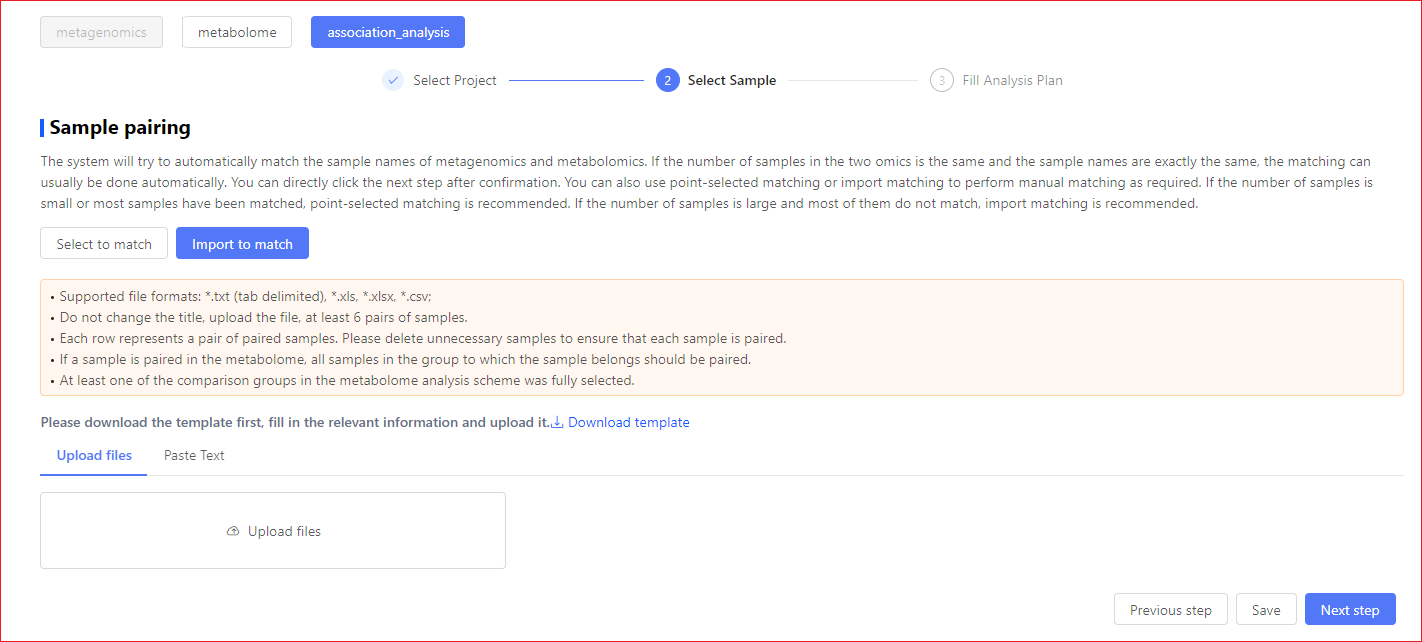
Import to match
Please complete the match by downloading the sample list, placing the samples that need to be paired on a single line as needed, uploading the modified paired files into the system, or pasting directly into the input box.
Tips
① Please edit the downloaded file with Excel software; ② Each row represents a paired sample, please remove unwanted samples to ensure that each sample is paired on; ③ If a sample is paired in the metabolome, all samples within the grouping in which that sample is located should be paired in all;
④ A third column to import a match is optional, where you can enter a new name for the sample. :::warning, the entry sample name must conform to the following rules
- sample names allowing English letters, numbers, and underlining composition and must begin with letters;
- maximum 15 characters;
- sample names cannot be repeated (ignoring case examples such as A1 with a1 treated as synonymous);
Step 3: Fill in the protocol
You will be required to determine the protocol name (optional), sample name, grouping scheme, screening conditions, etc. when filling in the protocol.
- The scheme name is optional, but you are strongly encouraged to complete a meaningful name that is convenient for you to remember and find.
- Sample and grouping scheme the grouping name, which determines their name in the results of the analysis. In all tables of results, the names filled in the protocol will be adopted, as will the sample names (if any) and grouping names (if any) in all figures of the results.
- The comparison group setting, which determines which groupings will be differentially compared in the difference analysis. The comparator set for the association analysis is with the metabolome, and you will only need to select the well set comparator set within the metabolome.
Tips
You are required to promptly SUBMIT or SAVE when the protocol is completed.
- The submitted protocol will enter the analysis process and send notifications to your mailbox when the analysis is complete;
- If you exit the system, you can find the last uncommitted protocol in
My Reportand continue editing it; - The parameters for the new analysis are detailed in the system. If you are using it for the first time, please read the instructions carefully;
- There are three free opportunities to create a new analysis protocol for each base data.
View result report
Report Entry
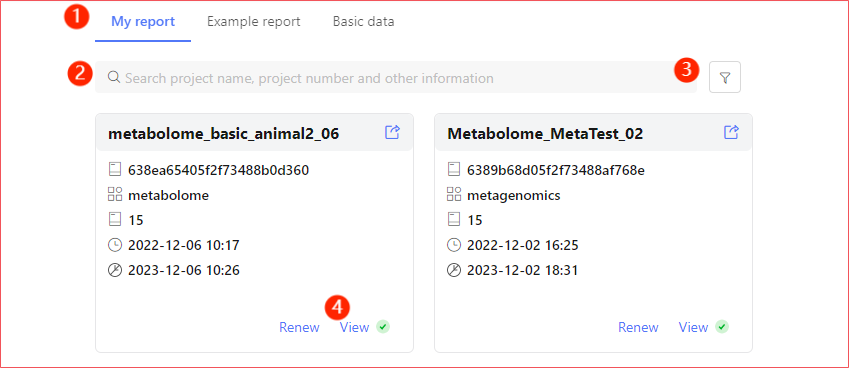
When you receive the email notification of completing the analysis, log in to the system as the email address you received. You can find and view the analysis results in My Report (①). Through the red dot (④) on the upper right corner of the Card Page View Button, you can quickly locate the completed but not viewed reports.
You can also enter the name you filled in the scheme through the search bar (②) or filter (③) to quickly locate the report.
Report Page Layout
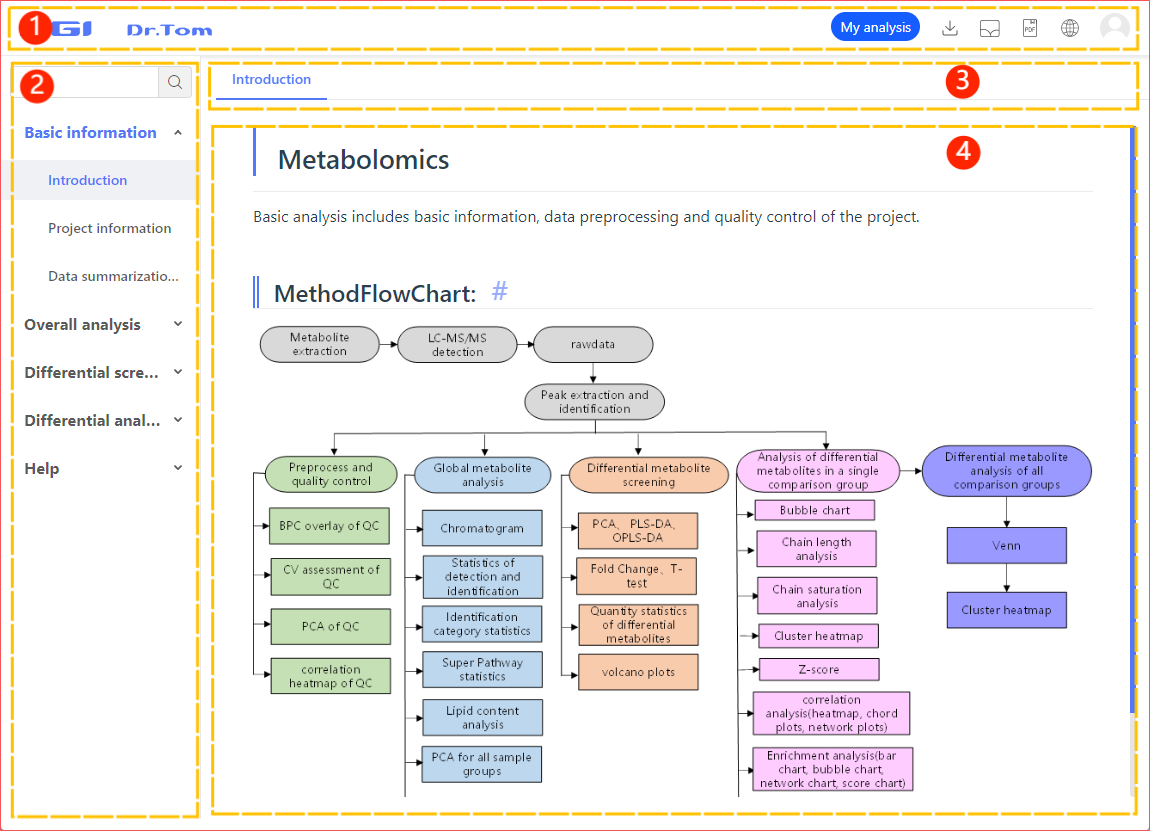
The result page consists of top bar, side bar, result switch and result area.
- Top bar: Resident function, including My Analysis, Download Data Package, Graph Library, Download PDF, Language Switch;
- Side bar: Click the sidebar to enter the corresponding analysis content and help;
- Result switch: Switch between different results or view help here;
- Result area: There are three situations in the result area
a. Process results: The results of process analysis are presented here, and the analysis description and result description are also listed. At the same time, you can customize the generated results.
b. Help: The help page displays detailed analysis instructions and possible problems.
Introduction to important functions
On the specific result page, you can view the plotted data, download the intermediate data of the analysis process, modify the picture, and filter the data to redraw the picture.
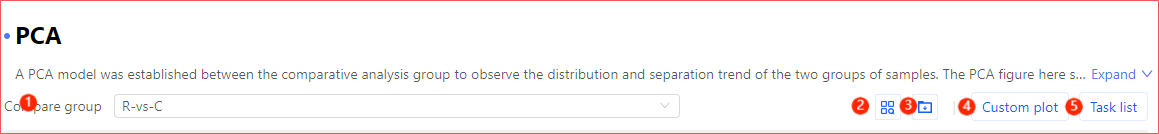
- Figure Switch parameters: different results of this analysis can be viewed through different combinations of Figure Switch parameters.
- View all graphs
 :Graphs with different Figure Switch parameters can be previewed here, packaged and downloaded.
 - Related file download
 :Non plotting files generated during analysis can be downloaded here.
 - Custom plotting
 :Click the
 Custom Plotto open the parameter setting panel, set the data processing parameters as required, and then submit the user-defined drawing task. - Task list
 :
:custom plottingThe submitted tasks can be viewed here.
- Picture
 table
table  Switch: the analysis result visualization result is a graph, and the direct drawing data is a table. The system can switch the graph view at the same time.
 - Picture setting
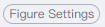 :Click to expand the setting panel of the corresponding image, and adjust the color, font, font size and other parameters of the image as required.
 - Add to the gallery
 :You can add the pictures you are satisfied with to the gallery for later viewing.
 - Download picture
 :The system provides PNG, JPG, SVG and PDF image downloads.
 - Enlarge the image display area
 :Click this button to expand the image display area to obtain a wide field of vision.
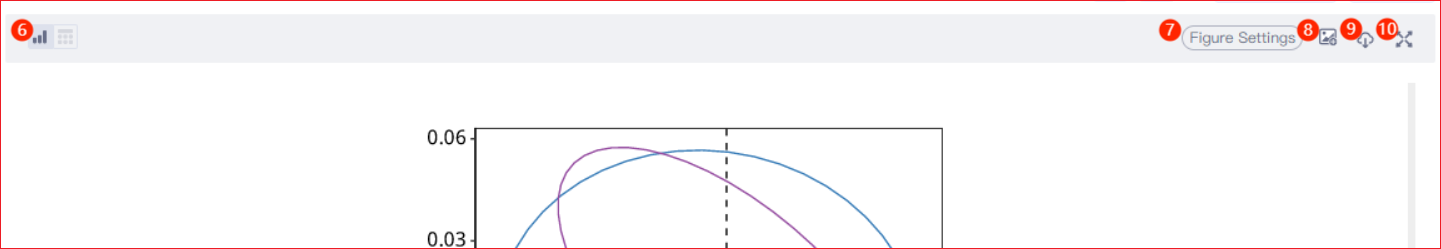
- Table on the right:Some analysis result pages provide the table on the right, you can click the extended column
 Set the header of the table on the right. At the same time, you can click some elements in the left picture, and the data contained in the right table will be filtered synchronously. By default, only one element can be selected, Multiple elements can be selected after multiple selection is enabled
 is enabled.
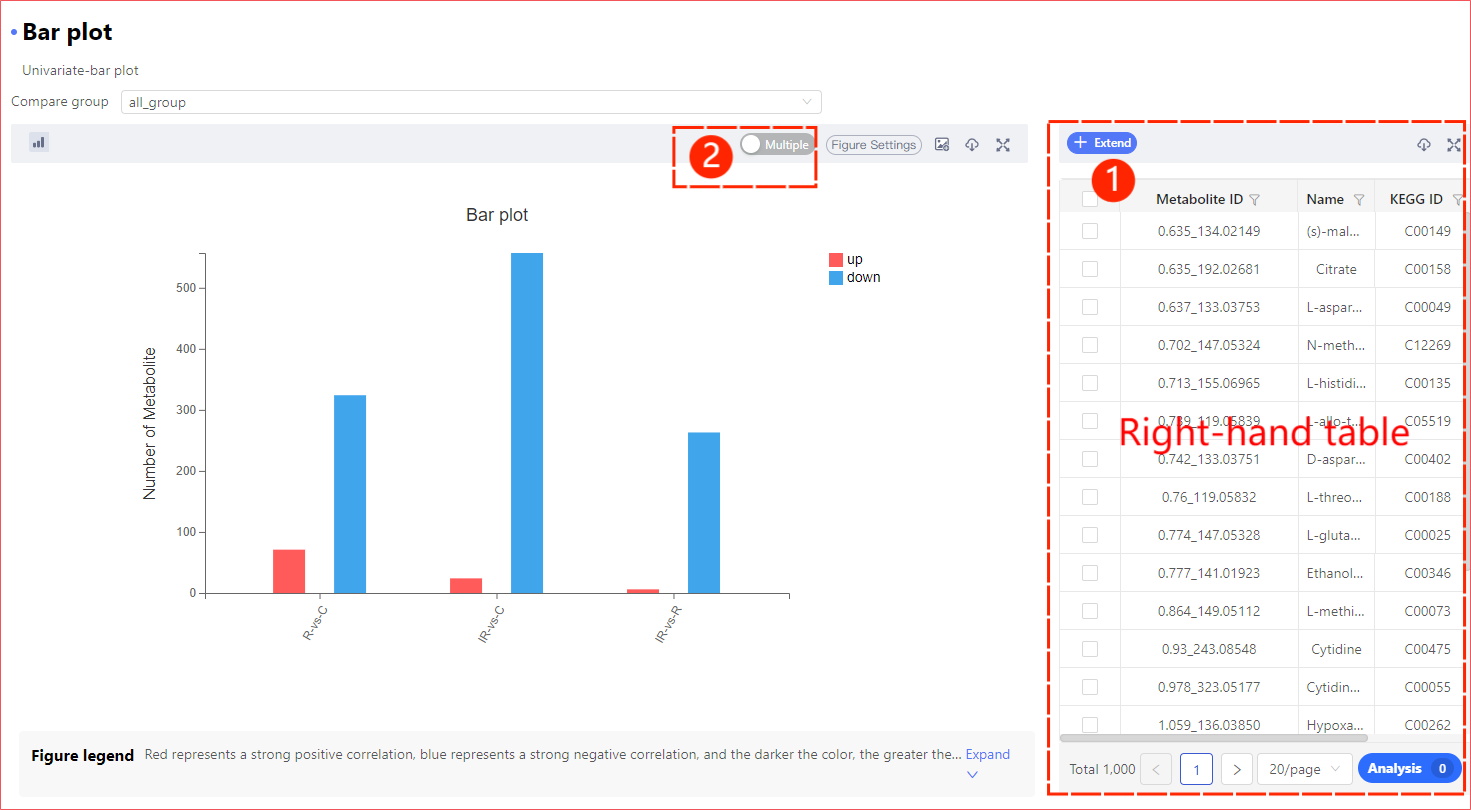
Figure Setting Details
You can adjust some of the pictures as required, including the existence, size and color of the elements in the picture.
Note
All your changes to the picture are only for the current analysis results, and the results will not be saved, which means that when you exit the system, the current changes will be lost. Therefore, it is strongly recommended that you download the satisfactory results in a timely manner, or add them to the gallery.
If you need to apply parameters (color matching, font, etc.) to other results after cutting, you need to turn on Apply Parameters to Switched figure. Note that this parameter only takes effect when cutting. When you switch analysis types, the graph parameters will also be lost.
Red asterisk * indicates that this parameter is required; Some parameters have detailed explanations. Hover the mouse over the question mark next to the parameter title![]() , you can see the specific explanation of the parameter.
, you can see the specific explanation of the parameter.
Filter data to replot
The graph setting only modifies the style of the picture. What changes is the presentation of the picture. The custom drawing and small tool will filter and shape the data according to your settings, and use the default graph setting to draw according to the color matching and grouping in the filling scheme.
Custom plotting
According to the analysis method and the input data type, the data is processed to a certain extent, and then the default drawing parameters are used for drawing, which is a user-defined drawing. User defined drawing results can be viewed in the Task List or My Analysis.
- Sample selection:During PCA, CCA and PLSDA analysis, you can select samples according to the analysis requirements.
- Top number and sorting objects:You can select the metabolites of Top N of the specified sorting object (p value sorting or q value sorting) according to the analysis requirements.
- Threshold filtering:During correlation analysis, you can manually set the threshold conditions for correlation judgment.
- Number of pathways: When doing enrichment analysis, you can set the number of pathways manually.
Small tool
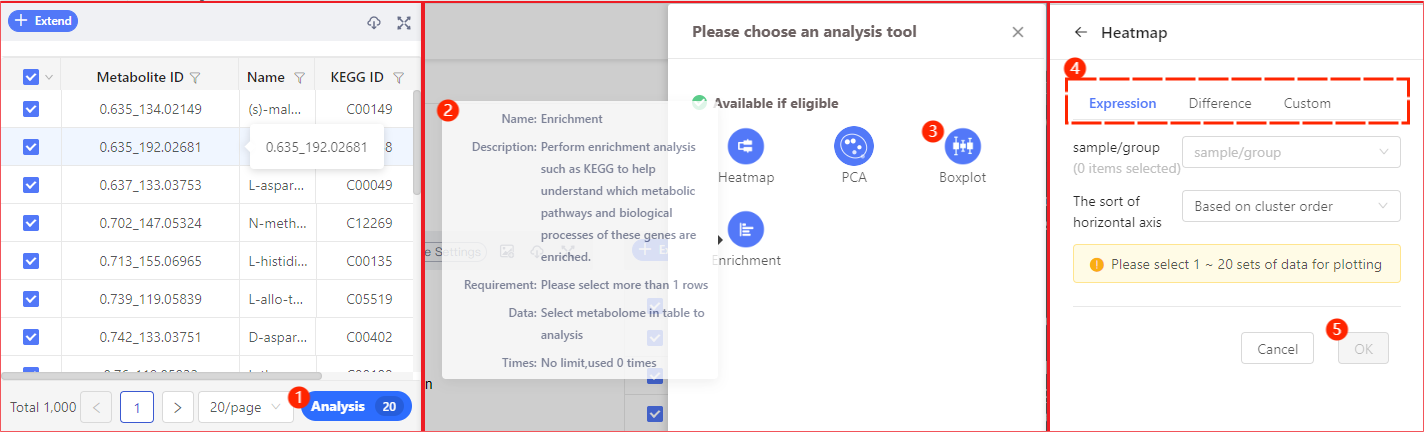
The analysis result page with the table on the right provides a richer interaction experience. When you select an optional area of the picture, the table on the right will automatically filter out the data contained in the area. You can also filter the data manually, enter from the Analysis button, select any available gadget to submit the data you filtered for analysis, and view the results in My Analysis.
Detailed steps:
① Filter out the appropriate data in the table on the right, which will be used in the next steps, and then click the Analyze button.
② In the tool selection interface, hover the mouse over the tool to introduce the tool. If the tool is unavailable, the tool button will be grayed out and the unqualified conditions will be marked.
③ Select an appropriate tool to enter parameter setting.
④ First select the data types to be analyzed, including expression data, variance data, and other data.
⑤ After setting the qualified data, click OK to submit the analysis. The analysis results can be viewed on the My Analysis page.
Other functions

1、My analysis
My analysis page records all the user-defined drawings and gadget drawings you submitted. Click the specific item to enter the corresponding analysis results. On the results page, you can also customize the results to some extent, or you can customize the results you are interested in.
2、Data package download
Here you can download all the data generated in the standard process analysis process (excluding the modifications made after logging in the report).
3、My gallery
Click Add to Gallery in the results The pictures added to the gallery can be found here.
4、Download PDF
At the end of system standardization analysis, the system will generate a standard report, which covers most of the analysis results.
5、Switch language
The system provides two languages: simplified Chinese and English.
6、Personal Center
Lists other reports generated by the basic data associated with this report.
Other matters
- In order to ensure the user experience, please try to use the system on a 14 inch or above screen.
- If you have questions about the analysis method and the meaning of the analysis results. You can directly press Ctrl+F on the corresponding analysis point help page/system help page to enter keywords for search.
- For more detailed system instructions, you can view them in 『Help』-『User Manual』in the report or in the help system of the metabolic group.(https://biosys.bgi.com/help/en/association/)