User Manual
User Manual
Essential Terms
Basic data: The basic data of a metabolome include quality control results, sample information, identification table, and peak intensity table, which are the basis of Dr. Tom metabolome analysis.
Analysis plan: To get the final results from the basic data, you need to specify and confirm the sample name, comparison groups, and necessary analysis parameters, which form an analysis plan.
Analysis process: The analysis process, simply referred to as the process, is the process of standardized analysis according to your analysis plan, and the results obtained in the process will be presented in your report.
Switch between figures: After setting an analysis plan, the system will analyze each analysis point accordingly. Multiple results may be presented according to different groupings and/or other parameters. The process of changing the analysis parameters to get different analysis results on the results page is called switching between figures.
Figure settings: If you need to make adjustments to the figures drawn in the analysis process, you can click Figure Settings on the results page to change the settings of the current figure. Modifying figure settings generally do not change the data needed for drawing the figure.
Custom drawing: On the analysis result page, you can click Custom Drawing button if you have an analysis to perform that is not involved in the process. The custom drawing will filter the data as required and draw figures using the preset figure settings of the plan.
Mini-tools: Like custom drawing, mini-tools can be used to filter data and redraw figures. The difference is that mini-tools provide higher degrees of freedom in data filtering and even allow manual filtering.
Create an Analysis in Three Steps
If your service contract covers the analytical services, basic data will be generated from the raw mass spectrometry data, and an email notification will be sent to you, at which point you will be able to log in to the system (https://biosys.bgi.com/) with the email account you received the email with to create a new analysis plan in the Basic Data tab.
Note: If you forget your password, you need to reset it first.
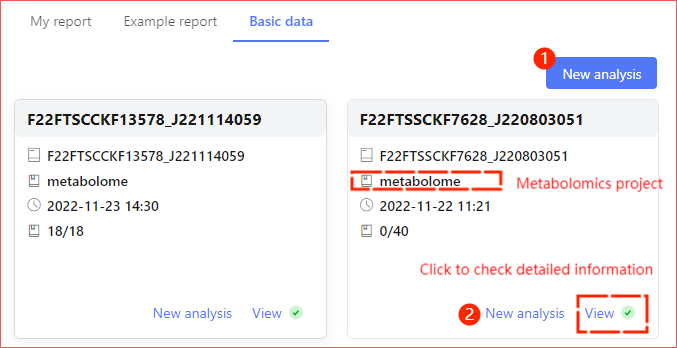
On the Basic Data page, each card represents a project, and newly created projects will be marked with a red dot. The project is available when there is a green check mark next to the View button. You can click the View button to go to the project detail page to view the quality control results, sample information, identification table and peak intensity table.
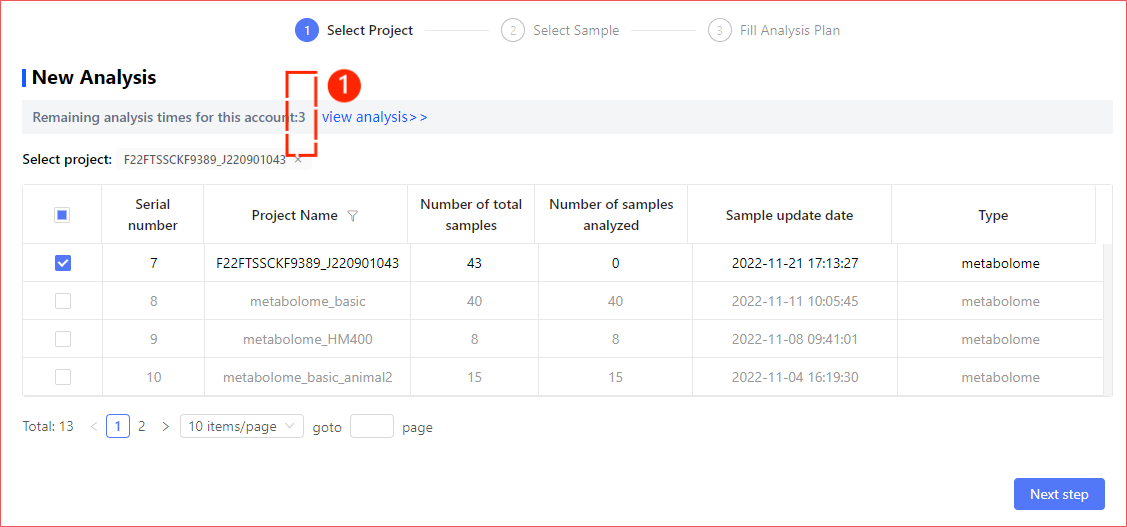
Step 1: Select a Project
When you create an analysis at ① in the above figure, you need to select an analysis project manually; when you create an analysis at ② or on the basic data viewing page, the current project will be selected by default. For each batch of basic data, you can create 3 new analyses for free.
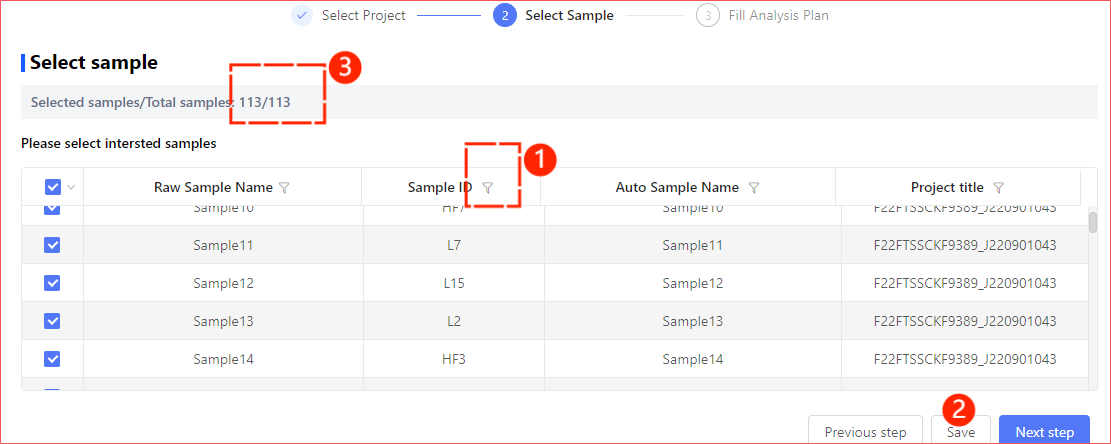
Step 2: Select Samples
After selecting an analysis project, all applicable samples will be listed. Please select the samples to be analyzed next according to your needs.
Tips
① You can filter as needed, and select the results all at once.
② You can save the current selection temporarily and continue to complete the analysis plan in My Report.
③ Please make sure that the quantity of the selected samples is as expected.
Step 3: Complete the Analysis Plan
To complete the plan, you will need to determine the plan title (optional), sample names, grouping scheme, comparison group setting, metabolite filtering conditions, etc.
- The plan title is optional, but it is highly recommended that you fill in a meaningful title that is easy for you to remember and use it to find the plan.
- The group names in the samples and the group scheme will be used in the analysis results. The names filled in the plan will be used in all tables in the results, and the sample names (if any) and group names (if any) specified in the plan will also be used in all figures in the results.
- The comparison group setting determines the groups to be compared in variance analysis.
Tips
Remember to submit or save the plan once you finish editing.
- The submitted plan will enter the analysis process, and a notification will be sent to your email address once the analysis is completed.
- After logging out of the system and logging in back again, you can find the previous unsubmitted plan in
My Reportand continue to edit and submit it. - The parameters of creating an analysis are explained in detail in the system. If you are using the function for the first time, please read the descriptions carefully.
- For each batch of basic data, you can create 3 new analyses for free.
View Result Reports
Report Entrance
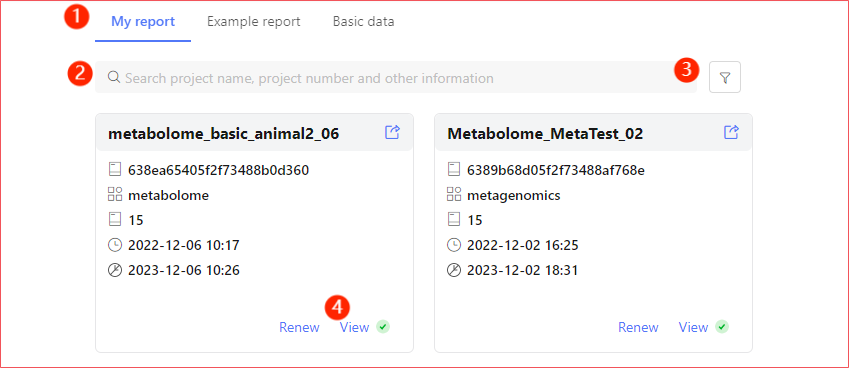
When you receive an email notification of the completion of your analysis, log in to the system with that email address, and you will be able to find and view the analysis results in My Report (①). The red dot (④) in the upper right corner of the View button in the card page allows you to quickly locate reports that have been completed but not viewed.
You can also quickly locate the report by entering the plan title in the search box (②) or using the filtering function (③).
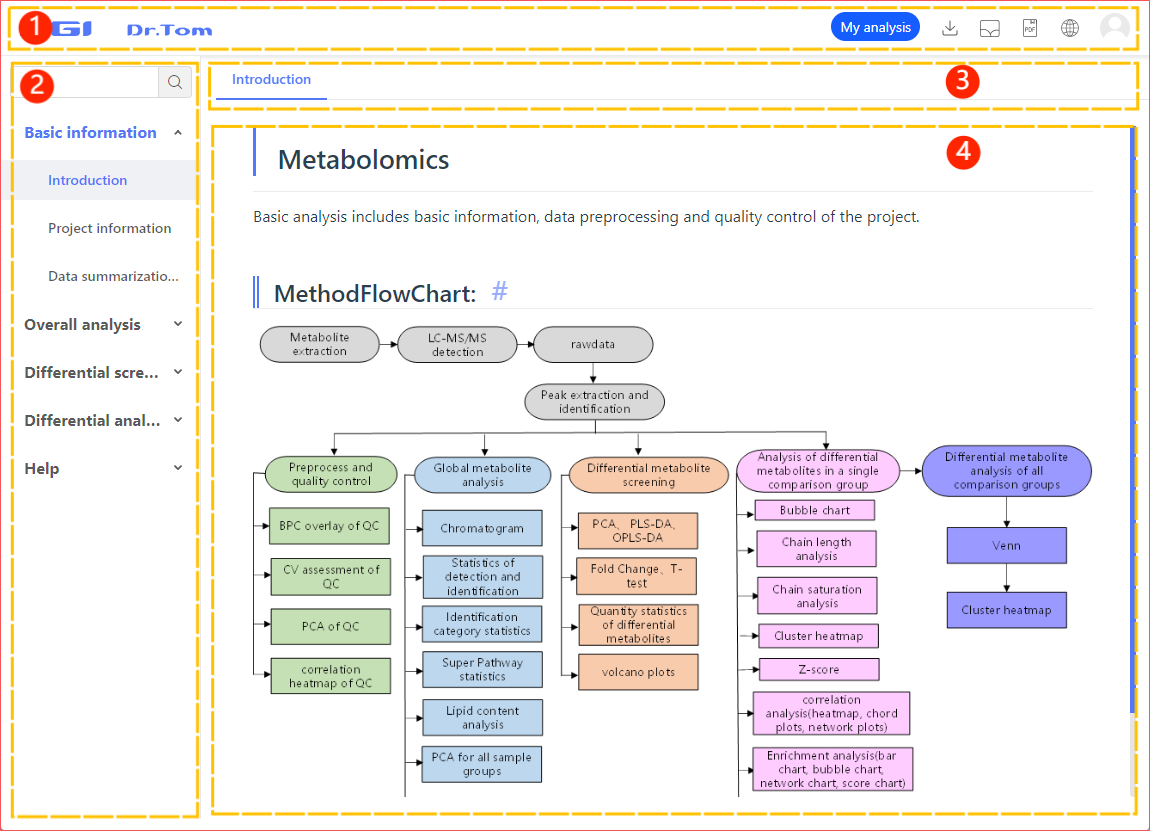
Report Page Layout
The result page consists of a top bar, a sidebar, a result switching area, and a result display area.
- Top bar: provides access to fixed functions, including My Analysis, Download Data Package, Gallery, Download PDF, and Switch Language.
- Sidebar: Click the sidebar to access the corresponding analysis content and help.
- Result switching area: Here you can switch between results or view the help.
- Result display area: The result display area displays one of the following:
a. Process results: The results generated by the analysis process are presented here. Analysis descriptions and result descriptions are also provided. And you can also customize the displayed results.
b. Help: The help page displays detailed descriptions of the analysis and issues that may be encountered.
Introduction of Important Features
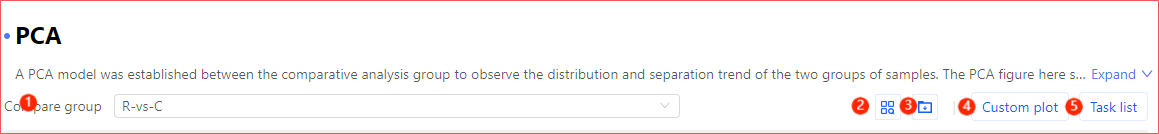
On a specific result viewing page, you can view the plot data, download the intermediate analysis data, edit the figures, and filter the data to redraw figures.
- Figure switching parameters: Different combinations of figure switching parameters allow you to view different results obtained in the analysis.
- Check All Figures
 : The figures obtained with different figure switching parameters can be previewed here and downloaded as a package.
 - Download Relative Files
 : The non-drawing files generated during the analysis can be downloaded here.
 - Custom Drawing
 : Click the
 Custom Drawingbutton to open the parameter setting panel, set the data processing parameters according to the requirements, and submit the custom drawing task. - Task List
 : Tasks submitted by
 Custom Drawingcan be viewed here.
- Figures
 -Table
  Switch: Analysis results are visualized as figures, and the data directly used for drawing the figure can also be viewed in a table. The system allows switching between the figure view and the table view.
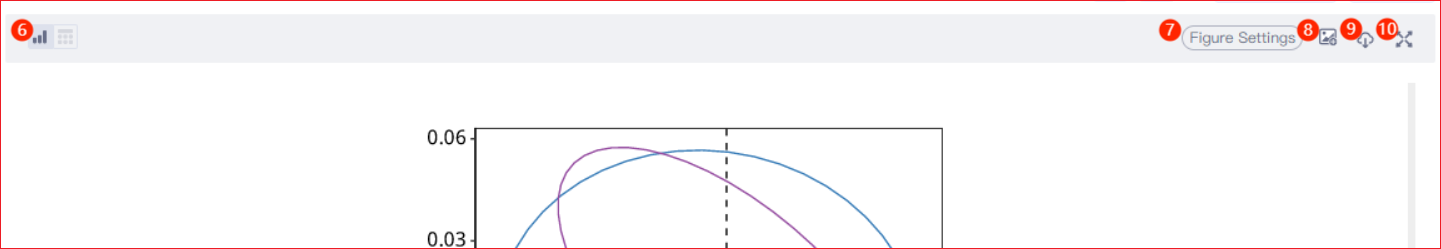
 - Figure Settings
 : Click to expand the setting panel of the corresponding figure and adjust the color, font, font size, and other parameters of the figure according to your needs.
 - Add to Gallery
 : You can add the figures you like to the gallery for later viewing.
 - Download Figure
 : The system provides figure downloads in four formats: PNG, JPG, SVG, and PDF.
 - Enlarge Figure Viewing Area
 : Click this button to expand the figure display area to get a wide range of view.
- Right-hand table: Right-hand table displays on some analysis result pages. You can click Expand Columns
 to customize the headers of the right-hand table. When you select some elements of the figure on the left, the table on the right will filter and show only the data contained in that element synchronously. By default, only one element can be selected. Turn on multi-selection
  to select multiple elements.
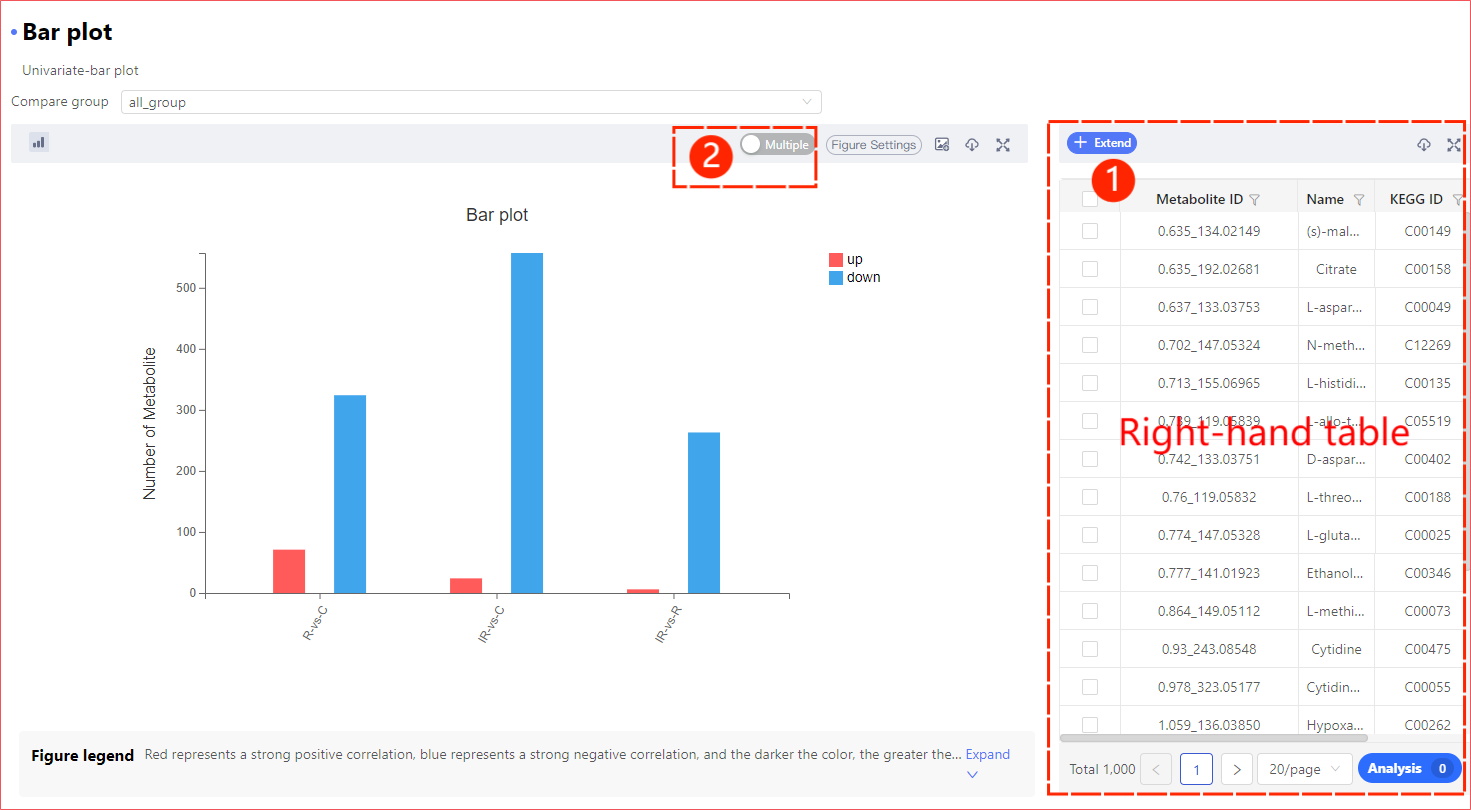
Figure Settings Instructions
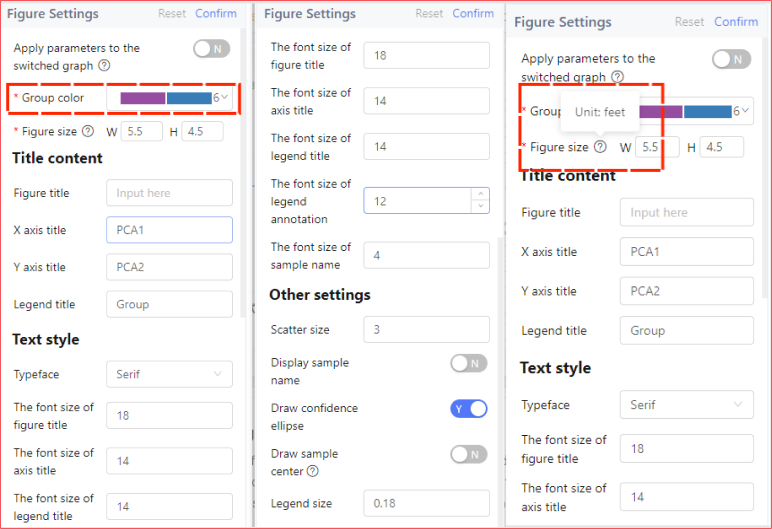
You can make adjustments to some of the figures as needed, including adjusting the presence, size, and color of elements in the figure.
Please note that
All changes you make to the figure settings are for the current analysis results only and are not saved. This means that when you exit the system, the current changes will be lost. Therefore, it is strongly recommended that you download satisfactory results in time or add them to the gallery.
If you need to apply the parameters (color scheme, fonts, etc.) to later results after switching figures, you need to turn on Apply Parameters to Later Figures. Note in particular that the parameters are only kept across figure switching; when you change the analysis type, they will still be lost.
The red asterisk * indicates that the parameter is required. Some parameters have explanatory text; hover your mouse over the question mark next to the parameter name ![]() to view the explanation.
to view the explanation.
Filter Data to Redraw Figures
Modifying figure settings only changes the style and presentation of the figure, while the custom drawing function and the mini-tools filter and shape the data according to your settings and use the default figure settings together with the color scheme and group settings specified in the plan to draw figures.
Custom Drawing
The custom drawing function processes the data in a certain way based on the analysis method and the input data type, and then uses the default parameters to redraw figures. Custom drawing results can be viewed in Task List or My Analysis.
- Designation of numerator and denominator between the comparison groups: The up-regulation and down-regulation conclusions in metabolome analysis are based on correctly distinguishing the numerator and denominator data, which requires you to manually specify the numerator and denominator in your custom analysis.
- Sample selection: In PCA and PLSDA analysis, you can select the samples to be included according to your analysis needs.
- Number of metabolites and sorting parameters: You can choose to display the Top N metabolites of a specified sorting parameter (p-value or q-value) according to your analysis needs.
- Filtering with threshold values: When conducting correlation analysis, you can manually set the threshold values for correlation judgement.
Mini-Tools
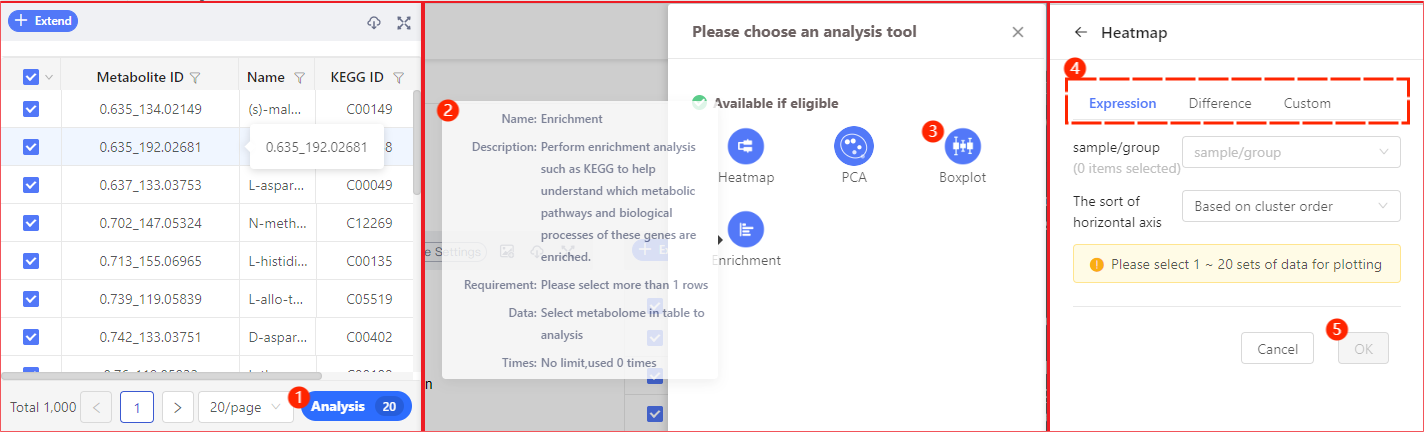
The analysis result page with a right-hand table provides a richer interactive experience. When you select a selectable area of the figure, the table on the right will automatically display the data contained in that area. You can also manually filter the data and click the Analyze button, select any of the available mini-tools to submit the data you filtered for analysis, and view the results in My Analysis.
Specific steps for use:
① Filter out the appropriate data to be used in the next steps using the table on the right, and then click the Analyze button.
② In the tool selection interface, hover the mouse over a tool to view its description. If a tool is unavailable, the tool button will be grayed out, and the unqualified conditions will be marked.
③ Select an appropriate tool and enter the parameter setting page.
④ First select the type of data to be analyzed. The possible options are expression data, difference data, and other data.
⑤ After setting the qualified data, click OK to submit it for analysis. The analysis results can be viewed on the My Analysis page.
Other Functions

1. My Analysis
The My Analysis page records all the custom drawing and mini-tool drawing tasks you have submitted, and you can access the corresponding analysis results by clicking the specific item. On the results page you can further customize the results or bookmark and customize results of interest.
2. Download Data Package
Here you can download all the data generated during the standard analysis process (excluding changes made after registering the report).
3. My Gallery
You can find here the figures you added to the gallery by clicking the Add to Gallery button.
4. Download PDF
The system will generate a standard report that covers most of the analysis results at the end of a standardized analysis.
5. Switch Language
The system supports two languages: Simplified Chinese and English.
6. Personal Center
Other reports generated from the basic data associated with this report are listed here.
Additional Notes
- For a better experience, use this system on a 14'' or larger screen.
- If you have any doubts about the analysis method and the meaning of the analysis results, you can search directly by pressing Ctrl + F on the analysis point's help page/system help page and entering the keywords.
- More detailed instructions for using the system can be found in the report at Help - User Manual or in the Metabolome Help System (https://biosys.bgi.com/help/).