FAQ
On this page, we summarize the common 🙋questions about the use of the system , solution of analyze questions, and so on。You can press CTRL + F to enter the keyword to search.
1. System usage
System usage
Q:How to adjust picture sample order and change sample name or group name?
A:When creating new analysis, sample name, sample grouping, group name and sample ordering have been determined according to your initial setting. The system does not support modifying the above information in this round of analysis. If you need to modify this information, create a new analysis and apply the changes to this analysis.
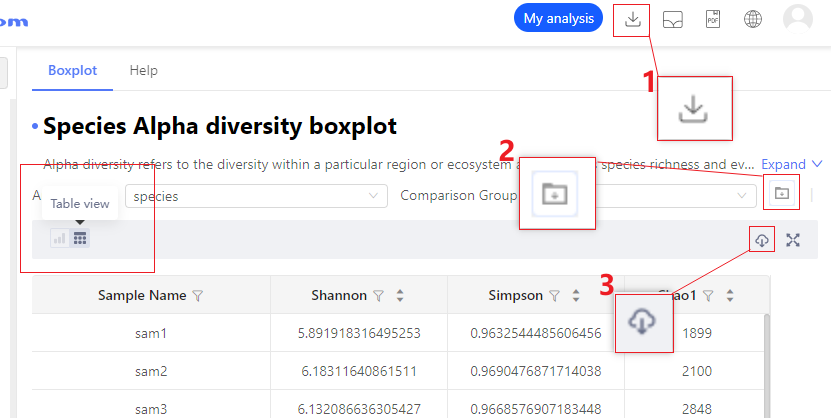
Q:How to download analysis results?
A:The system provides three kinds of analysis results that can be downloaded: (1) download direct drawing data, (2) download analytics-related intermediate data (if any), and (3) download all related files of the entire analysis report **.
Info
Analysis report includes species abundance table. Functional abundance table is delivered with Clean Data.
Q:What are the descriptions of files in the delivery folder?
A:In the folder directory, a file called files.txt describes the meaning of each file and the result.
Q:Why do some strange data or irregular display effects appear when opening certain files with Excel?
A:The original files of the sequencing data are very large, and the intermediate files during the analysis process may also be very large. When these files are opened with software such as Excel, there may be problems such as garbled characters or confusing lines. For example, if you open Kegg’s annotation file directly with Excel, a line of text may be split into multiple lines, as shown in the figure below: 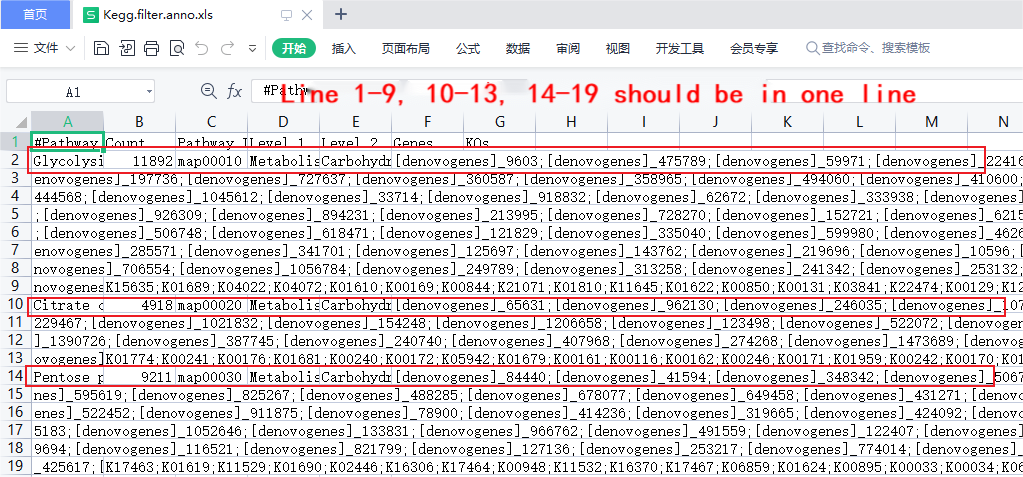
In this case, you can view the file in the following ways:
- Use a text editor in Windows system
- Use the command line tools of Linux system
Q:How to parse the result of the image?
A:We provide detailed descriptions for each analysis result
- Short description of the analysis at the top of the results page
- In the description below the picture, there are the meaning of the picture elements and the basic meaning of the file
- There are detailed analysis instructions in the help page
Q:How to re-edit and convert pictures?
A:The Dr.Tom system provides commonly used image modification parameters, and also provides methods for downloading images in PNG, SVG, PDF, and JPG formats. If you need more personalized image editing, you can download the vector graphics in SVG or PDF format and modify them with suitable software.
- Use SVGDeveloper to modify image files in SVG format
- Use Adobe Illustrator to modify the PDF format file; image conversion: use the above software to open the image and save it as the required image format
Q:Do you provide personalized analysis and visualization services other than the Dr Tom system?
A:It is recommended to use Omiscribe (https://omiscribe.bgi.com/), a data visualization platform oriented towards scientific research article-level drawing developed by BGI.
Questions about the number of analyzes
Q:What is the rule of analysis times for metagenomics?
A:For every project, we provide 3 free analyzes by default. If you have used up these 3 analysis times, please contact sales to purchase more analysis times.
2. Wet experiment and sequencing
Wet experiment
Q:What is the requirement for sample duplication in metagenomic survey?
A:The number of samples in each subgroup is greater than or equal to 3, and the recommended number is 10.
Q:Experimental methods and reagents used for DNA extraction
A:Extraction of intact DNA is a prerequisite for ensuring the quality of the results. However, the composition of environmental samples is very complex, and currently there is no extraction scheme suitable for all types of samples. The more general extraction steps are listed below:
- Prepare five 96-well deep-hole plates and add 600 μ L Buffer bead binding solution + 20 μ L protease K + 5 μ L RNase respectively.
A, 700 μ L Wash 1, 700 μ L Wash 2, 700 μ L Wash 3, 100 μ L Elution Buffer - 100-200mg samples were taken into the centrifugal tube with grinding beads, and 1mL Buffer ATL/PVP-10 was added. After grinding the samples on a high-speed grinder, the 20min was incubated at 65 ℃.
- 14000g centrifuge 5m; transfer the supernatant to a new centrifuge tube, add 0.6 mL Buffer PCI, vortex mix 15s
- 12000rpm centrifuge 10min, transfer the supernatant to a deep-hole plate with magnetic bead binding solution
- Start Kingfisher to select the corresponding program, put each deep-hole plate in the corresponding position of the instrument, and run the program.
- At the end of the procedure, the DNA solution in the Elution Buffer deep-hole plate was transferred to a 1.5 mL centrifuge tube for preservation.
Q:Can metagenomic sequencing be performed if there is a lot of host DNA contamination and there is no reference sequence of the host genome?
A:Sample contamination refers to the non-target sequence fragments in the sequencing results. In addition to the non-target bacterial/fungal contamination introduced during sampling and experiments, contamination also comes from the host. If the host's genome content is relatively large, and we cannot remove the host's DNA information, there will be very little data related to the microorganism, which will have a great impact on the analysis results and cannot draw effective conclusions. Even if the content of the host genome is relatively low, the analysis still has certain risks. Therefore, minimizing host-derived DNA during sample collection is an important factor for project success.
sequencing
Q:The definiton of quality evaluation index Q30 and Q20
A: When the sequencer detects a fluorescent signal, the software interprets it as a certain base according to the preset rules, and the probability of misjudgment is , then the quality score (QualityValue, QV) of the base is defined as
When the correct rate is 99.9%, the error rate = 0.001, at this time the quality value is
The mass of this base is also known as Q30. Similarly, Q20 represents a base error rate of 1%, which is 99% accuracy, and Q10 represents a base error rate of 10%. In sequencing, the results of Q30 and Q20 are commonly used to indicate the overall sequencing quality, and the higher the proportion of Q20 and Q30 bases, the higher the quality of the sequencing results.
Q:What is sequencing depth and coverage?
A:Sequencing depth refers to the ratio of the total number of bases (bp) obtained by sequencing to the genome (transcriptome or the size of the sequencing target region), and is one of the indicators for evaluating the sequencing volume. The formula for calculating the sequencing depth is
:sequencing depth;:read length;:read number;:traget region
coverageis the proportion of sequenced sequences to the entire genome. The complexity within the sample varies with the source, so there will be different coverage requirements for different samples. For metagenomic projects, 5G clean data is generally recommended for simple environmental samples (such as mammalian gut), and more than 15G clean data is recommended for complex environmental samples (such as soil, ocean, etc.).
3. Basic data generation
Filter
none
assembly
Q: Can TPM be used for comparisons between different samples?
A:Yes. According to the principle of TPM, the sum of TPM of all genes in different samples is equal, so TPM is similar to the relative abundance in species annotation results, and can be compared between different samples/groups.
tax annotation
Q: How to download annotated species abundance data?
A: In the system, click the "Download analysis results" button at the top of the page, you can download all the analysis results and obtain complete species abundance data.
Path:TaxonomyAnalysis/Rename_Abundance:
- {Classification level}.absolute.xls is an absolute abundance table for the specified taxonomic level
- {Classification level}.relative.xls is the relative abundance table of the specified taxonomic level
- {Classification level}.{data type}.xls.header is temporary analyzing data. No need to worry about it.
Q: Why do some projects have more annotations and more species than others?
A: The number of species annotation results is related to the following:
- The complexity of the environment: the more complex the environment, the more annotated species, and vice versa. Environments such as soil and water are high-complexity environments, while intestinal (feces) samples are low-complexity environments.
- Number of samples: As the number of samples increases, unique species in the samples are detected, which will increase the overall number of species annotations.
- Sequencing depth: The more sequencing data, the more rare species in the sample can be annotated.
If only a few annotated species in the sequencing results, there may be the following reasons after excluding experiments (experimental contamination) and sequencing (data amount):
- Samples come from low-complexity environments with fewer species;
- The number of samples grouped is small and cannot cover most species;
- There are few researches on the species concerned, and there are few representative sequences and related information of the species in the database.
Q: What does NA mean in annotation results?
A: The species annotation of the metagenomic project uses Kraken2 software. The principle is to break the sequencing sequence into subsequences of length k (default k=35), called k-mer, and then compare the k-mer to the database . A k-mer that matches the database is assigned one to the taxonomic tree, and those that do not match are ignored. When all k-mers of a sequence are annotated, the species annotation result at the lowest level on the annotation tree is the species annotation result of this sequence. When all k-mers are annotated only to high levels, such as genus, family, class, then the lower levels of the sequence will be marked as NA.
Q: What is the basis for the selection of species annotation databases?
A: The system automatically selects the database for species annotation according to the sample type. The UHGG data is used for the sample from the human gut, and the NCBI NT database is used for other sources.
function annotation
Q:What is the basis for selecting a functional database?
A:The Dr.Tom system provides the functional annotation results of seven commonly used databases: KEGG, COG, eggNOG, Swiss-Prot, BacMet, CARD, and CAZy. Different databases have been properly optimized for specific data, such as BacMet focusing on fungicides and Metal resistance genes, CARD focuses on antibiotic resistance, you can choose the appropriate species annotation results according to the annotation purpose.
Q: How to download the functional annotation abundance table?
A: The functional abundance table is delivered offline together with Clean Data.
Q:Species annotation database version
A:The annotation database version is as follows:
| Database | Version |
|---|---|
| KEGG | v101.0 |
| COG | 20201125 |
| eggNOG | eggnog_5.0 |
| Swissprot | release-2021_04 |
| BacMet2 | 20180311 |
| Card | v3.1.4 |
| Cazy | 20240326 |
Q: Do databases annotate microbiota function at the genus level? Do we have to choose the results of one of these databases to interpret?
A: No, functional annotations do not depend on any species annotation results. Functional annotation is based on sequence information, and multiple databases can be used for analysis at the same time.
Q: In the KEGG annotation results, there is a one-to-one correspondence between map and pathway level3, but the abundance values are different?
A: We use different statistical algorithms to calculate the map and pathway level3: when calculating the map, if a KO is annotated to multiple maps, the KO will be evenly distributed to each map; when calculating the pathway level3, directly accumulate the KO abundance value.
4. analysis questions
Species/function distribution
Q:How to process data in statistical distribution Species/Function?
A:Showing too many elements in a single image makes the image appear crowded and it is difficult to get useful information from it. Based on this, the abundance data Species/Function used for mapping need to be screened:
- Classify to others: Keep the data that meets the filter conditions, and classify the data that does not meet the conditions into others.
- Species/FunctionFiltering: Keep the data that meets the filtering conditions, and discard the data that does not meet the conditions.
Filter criteria:
- The top N relative abundanceSpecies/Function
- The relative abundace greater than mSpecies/Function
Tips
Species/Function Both 'Classify to others' and' filter 'are based on the parameters set in the analysis scheme. However, due to the reason of graphics display, we have limited the maximum number of Species/Function displayed for some graphics. For details, please check the corresponding page description.
Species accumulation curve
Q: What is the species accumulation curve used for?
A: In different groups, the samples within the group are randomly resampled. The X-axis represents the number of samples resampled and the Y-axis represents the number of species. As the number of samples increases, the number of species in each group gradually increases, and finally reaches a plateau, indicating that the current number of samples is sufficient to represent the community distribution characteristics of the group, and increasing the number of samples will not significantly increase the number of species in the group.
Because of this, the species accumulation curve has a certain requirement for the number of samples in the group (at least 3).
diversity
Q: What is the difference between Bray-Curtis, JSD, and Euclidean distance?
A: The Euclidean distance is a symmetric index, treating double zero data as the same. The other two are asymmetric index, ignoring double zero data. A characteristic of Euclidean distance is that it is more sensitive to species abundance data than species existence, and the calculation method of Euclidean distance determines that its value range is infinite. So, for species abundance data with a lot of double zero data, Bray-Curtis and JSD are often used, and the Bray-Curtis dissimilarity index is the most commonly used index.
difference analysis
Q:What is the basis for choosing Venn diagram and UpSetR?
A:Select according to the number of groups. When the number of groups is less than 5, you can choose Venn diagram or UpSetR; when the number of groups is greater than 5, the Venn diagram cannot display so much data, so you can only choose UpSetR.
Q:What are the principles of using parametric test and nonparametric test?
A:If the data conform to normal distribution, parametric test is used first, followed by non-parametric test. Because nonparametric test is not as sensitive as parametric tests. If the data contain extreme values and cannot be removed for some reasons, non-parametric test can be used to test the ranking of the data, and extreme values have little impact on the results.
Q:How to interpret the results of the analysis of significant differences between groups?
A:The difference analysis between groups is the analysis of whether the difference between groups is significant at different taxonomic levels. Usually, a hypothesis test is used to verify that the probability of the difference evaluation data (such as the mean) being equal is the p value, and the p value is corrected to obtain the q value, and then the p value or q value is used to judge if there are the significant difference between groups.
Q:What does a statistical test p value mean?
A:p is the probability that the statistical test holds. The statistical test will propose two mutually exclusive hypotheses, is called the null hypothesis, is called the alternative hypothesis, the purpose of the significance test is to decide whether to accept and reject _p_value, Or accept and reject . When p < 0.05, the probability of being true is small, so is accepted and is rejected.
For example, test whether the abundance of a certain species is different in different groups. First come up with the hypothesis:
- :The species do not differ between the two groups
- :The species differs in the two groups
Then use the Wilcoxon test or T-test to calculate the p value, which represents the probability that holds. If p < 0.05, the probability of being true at this time is very low, and we think that the low probability thing cannot happen, so we reject , thinking that the species is different in the two groups.
Q:Why are there no difference analysis results in some comparison groups?
A:Differential analysis requires at least 2 groups, and there should be ≥ 3 biological replicates in each group. For groups that do not meet the sample requirement, no difference analysis will be performed.
Q:How to modify LEfSe group colors?
A:Currently, the system does not support modifying the LEfSe group color.
Q:What is the LEfSe analysis process?
A:The LEfSe analysis process is as follows:
- First, use the Kruskal-Wallis rank sum test to detect the difference in species abundance between different groups, and obtain significant differences (specified taxonomic level);
- For the significant differences in the previous step, compare the groups participating in the test, and use the grouped Wilcoxon rank sum test;
- Finally, use LDA (Linear discriminant analysis) to estimate the impact of these different species on the difference between groups, that is, to obtain the LDA score.
Q:What does the LDA score represent?
A:The LDA score represents the contribution of the species to the difference between groups.
Q:What is the main level of screening by the LEfSe analysis?
A:LEfSe analysis showed species with significant differences at all taxonomic levels.
Q:In the enrichment analysis, the enrichment Module or Pathway and its corresponding enrichment p values are not completely consistent between the two custom mapping results or between the custom mapping results and the existing results, and even the number in the enrichment results is not consistent. Why is this?
A:It has to do with the algorithm of the analysis. In the enrichment analysis, permutation tests will be performed, and each permutation test will extract data randomly, which will lead to slightly different results. Since the criteria for judging enrichment are fixed, the number of modules/pathways enriched may vary. Therefore, it is recommended to focus on those results with large differences.
Species correlation
Q: How to choose CCA or RDA to display the impact of environmental factors on community structure?
A: Model selection principles: RDA is based on a linear model, and CCA is based on a unimodal model. CCA is generally chosen for direct gradient analysis. But if the effect of CCA sorting is not very good, you can consider using RDA analysis.
First, use species abundance data to run DCA (Detrended Correspondence Analysis), and analyze the size of the first axis of Lengths of Gradient in the results. If it is greater than 4.0, you should choose CCA; if it is between 3.0-4.0, you can choose RDA and CCA; if it is less than 3.0, the result of RDA is better than CCA.
Q:Why the number of environmental factors for CCA and RDA must be smaller than the number of samples?
A: Both belong to constrained ranking, CCA is a nonlinear model, and RDA is a linear model. PCA analysis is a kind of non-constraint ranking, without environmental factor restrictions, and its principal components are unknown environmental variables. Constrained sorting refers to sorting species on specific environmental variables (environmental factors), that is, sorting in the direction of the coordinate axis. Therefore, if there are n samples and n coordinate directions are provided, it will not be able to play the role of this specific direction constraint.
Reference:
Legendre, P. and L. Legendre (2012). Numerical Ecology, 3rd English ed. Amsterdam: Elsevier Science BV.
Q: What is the reason for the specific value required for the CCA/RDA variable?
A: CCA and RDA are correlation analyzes of environmental factors. The algorithm model requires the data of environmental factors to be continuous (the data is a number with a size and order, such as pH value, temperature, etc.), and non-continuous variables cannot be used as environmental factor data. For example, to compare the difference between the treatment group and the control group, the treatment is recorded as 1, and the non-treatment is recorded as 0. Such variables are non-continuous variables (or called discrete variables) and can be used as grouping variables.
Q: What is the difference between Pearson's correlation coefficient and Spearman's correlation coefficient?
A: Pearson correlation coefficient is applicable to quantitative data, which must conform to normal distribution and have linear correlation between data. Spearman correlation coefficient applies to quantitative or hierarchical data, the data can fit any distribution pattern, and the data involved in the calculation is usually nonlinearly correlated.
Other analysis
Q:What is permutation test
A:In statistics, part of the sample data of the research object is collected to describe the whole object. The more samples being collected, the more accurate the description of the whole, but in practice, the number of samples collected is often limited.Therefore, permutation tests are used when the number of samples collected is small and the distribution is unknown.
The permutation test was originally proposed by Fisher in the 1930s and is essentially a resampling method. It randomly samples all (or part) of the sample data, and then compares the sample statistics obtained by sampling with the actual observed sample statistics. Through a large number of permutations (default 999 times in R), it calculates the probability that the statistics after the permutation is greater than the actual observed statistics, which is the p value of the permutation test. Statistical inferences are made based on p values.
Note
Because the permutation test is random sampling, the results of multiple permutation tests are not completely consistent.