Manual
Key terms
Basic Data : Tables of gene abundance, species abundance, and function abundance generated from sequencing data are called basic data, and basic data is the basis of Dr.Tom's systematic analysis. The underlying Data is delivered with Clean Data.
Analysis scheme : From the basic data to the final result, you need to fill in and confirm the sample name, comparison group, species screening rules and other information, which is called the analysis scheme.
Analysis and visualization : Statistical analysis of basic data, such as differences in species composition and community function between samples, is called analysis, and the corresponding results are called analysis results; The presentation of the analysis results in the form of pictures is called visualization, and the corresponding results are called visualization results.
Picture switch : After filling in the analysis scheme, the system will analyze according to the scheme. Each case may have multiple outcomes, depending on the grouping or other analysis parameters. In the result page, modify the comparison group, analysis level, drawing data and other parameters to adjust the analysis picture called picture switching.
Image Settings : If you need to adjust the image, click "Image Settings" on the results page to set the Settings. Graph Settings generally do not modify the input data needed to draw the picture.
Custom Drawing: On the result page, "Custom Drawing" will filter the data according to your requirements, and draw with the preset map settings of the scheme.
New analysis
On the basic data tab page, each card represents a project, and new projects are marked with red dots. You can click on the card to enter the details page to view the sequencing results, quality control results, assembly and de-redundancy results of the project, or click New Analysis to create a analysis plan within three steps.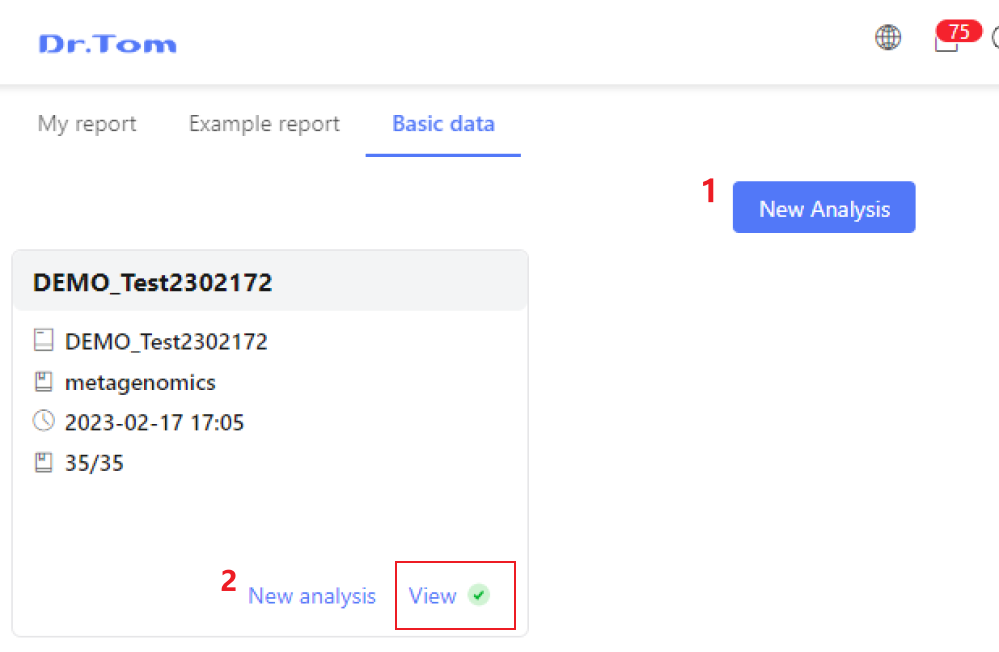
Step 1: Tick to select the project.
Be aware that only one project can be selected in this step.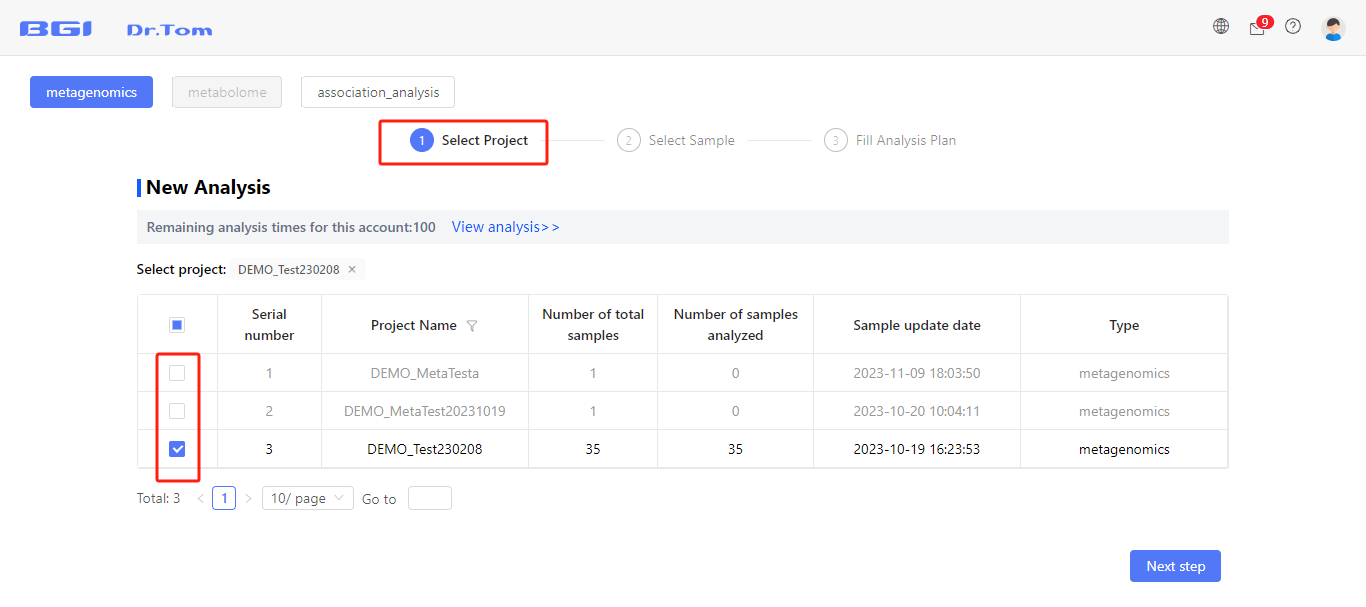
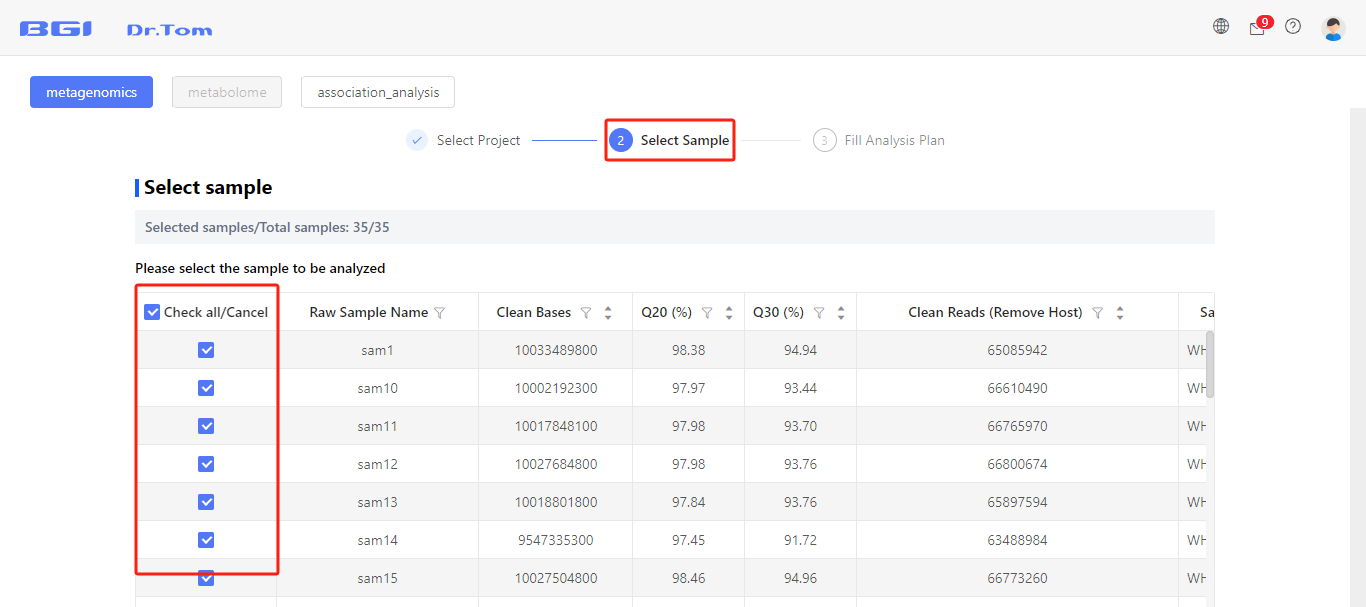
Step 2: Tick to select samples that you want to involve in this analysis.
Step 3: Fill the analysis plan.
3.1 Renaming and grouping samples.
Two patterns are provided for sample renaming and grouping.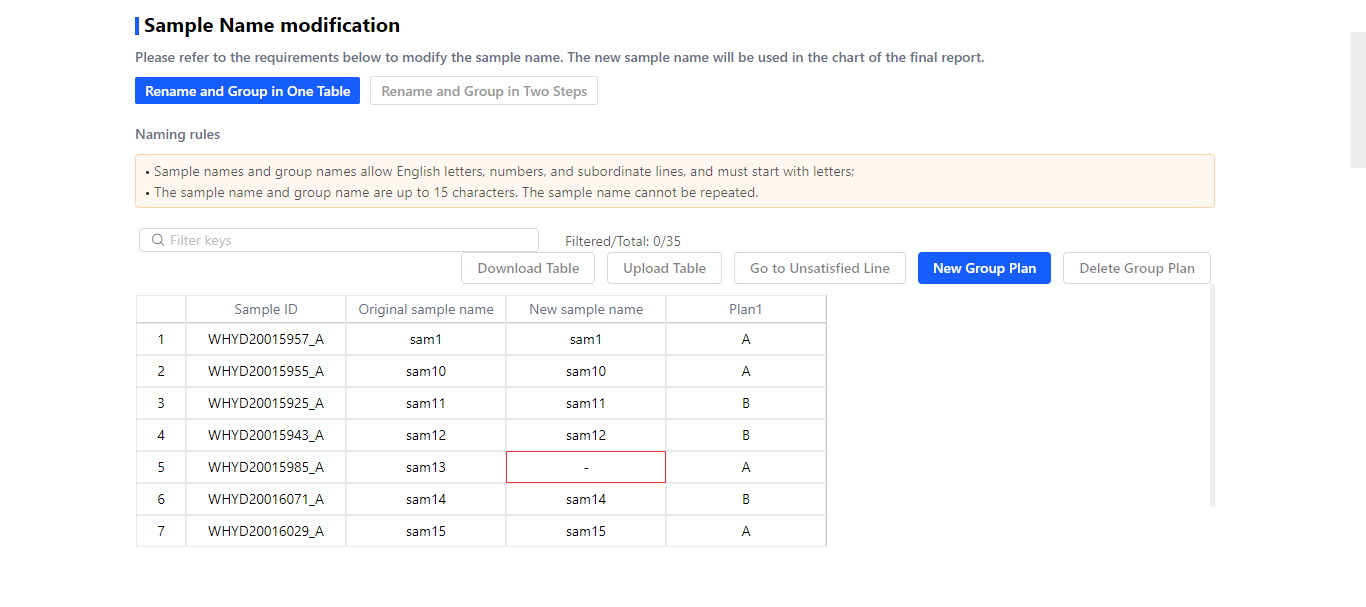
① Rename and Group in One Table
The table will be displayed after selecting this pattern.
Input new sample name in ‘New sample name’ column.
Input group name in the ‘Plan N’ column.
If there are several plans, click ‘New Group Plan’ to add new columns.
If the naming doesn’t meet the requirements, it will the red-marked.
If prefer to fill the table in Excel, you can download this table. After completing, click ‘Upload Table’ to upload it.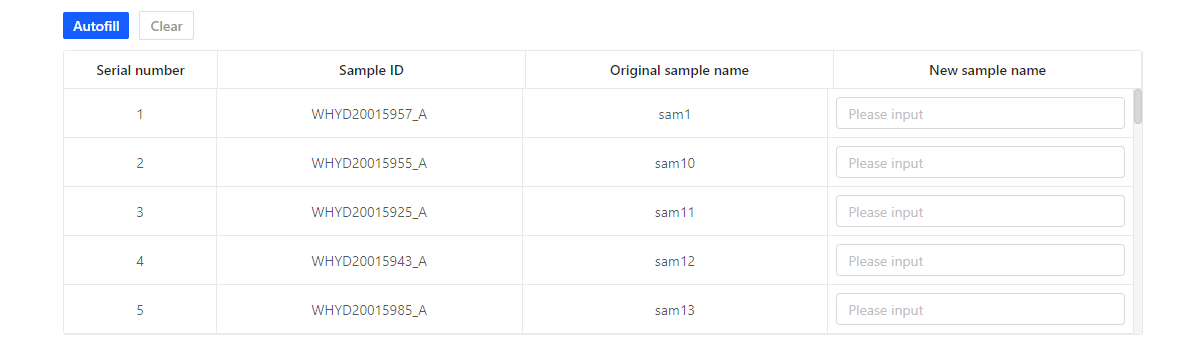
② Rename and Group in Two Step
In the first table, input new sample name. You can click ‘Autofill’, Dr. Tom will automatically give the sample a new name.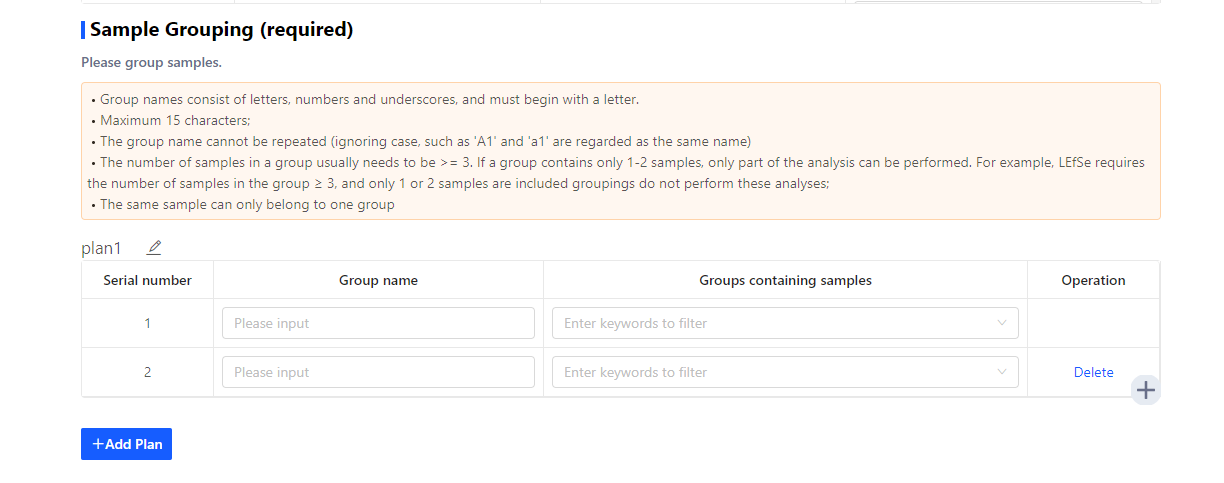
After naming the samples, set the grouping information in the following table.
Click ‘+’ to add groups
Click ‘+Add Plan’ to add analysis plan.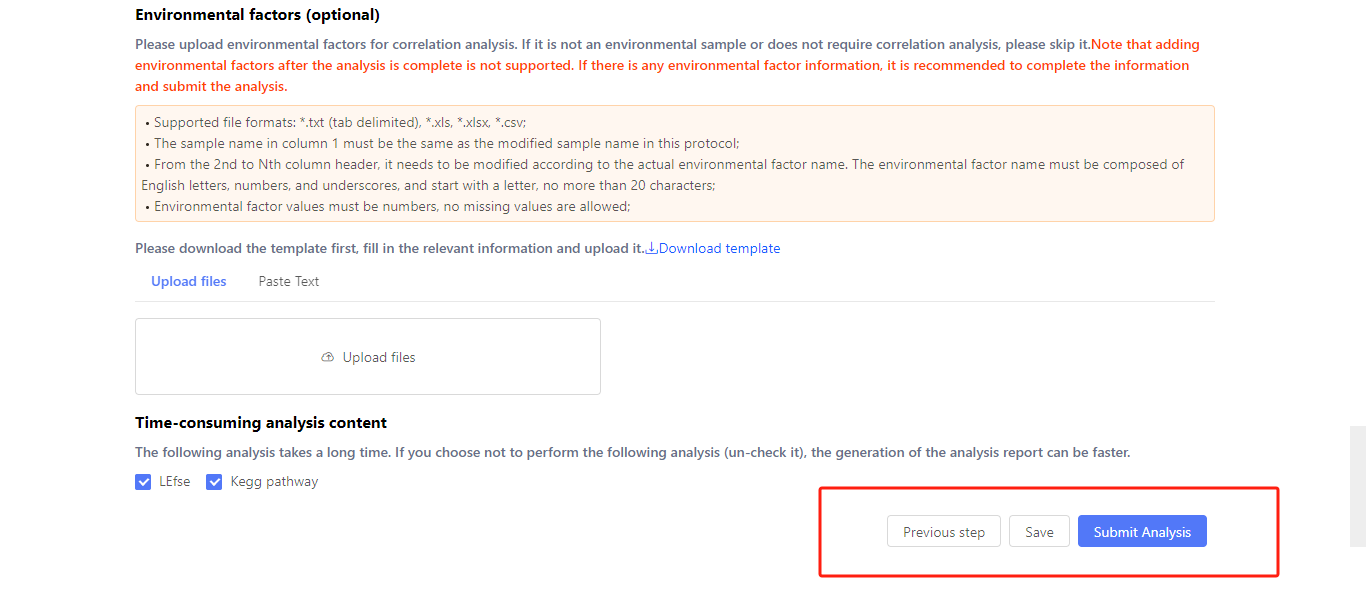
3.2 Set comparison groups
In metagenomics data analysis, the analysis results of all groups in a comparison group will be displayed in one graph.
Click the box and select the groups that belong to one comparison group.
Click ‘+’ to add more comparison groups.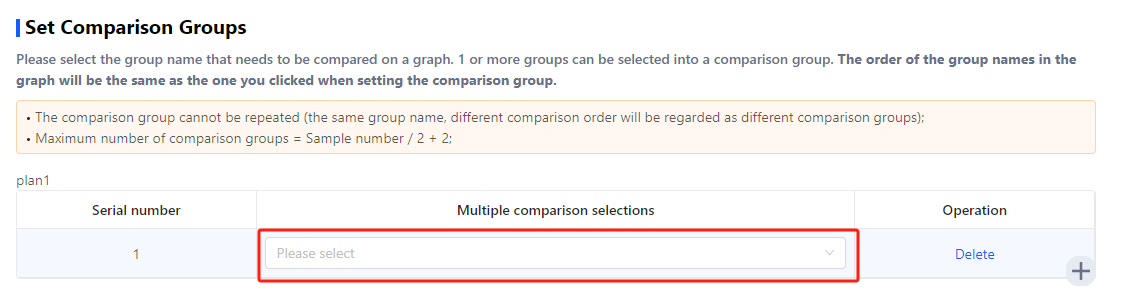
3.3 Set Analysis Parameters
You can set customized color scheme and some analysis parameters in this part.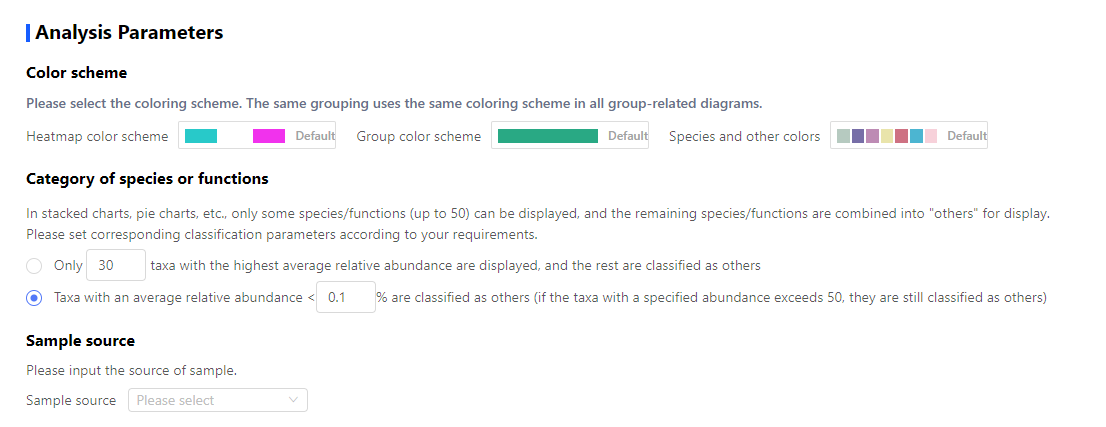
If environmental factors correlation analysis is required, upload the environmental factors here. You can download the template and fill the table following the requirements. Then, click ‘Upload files’ or paste the table on Dr. Tom.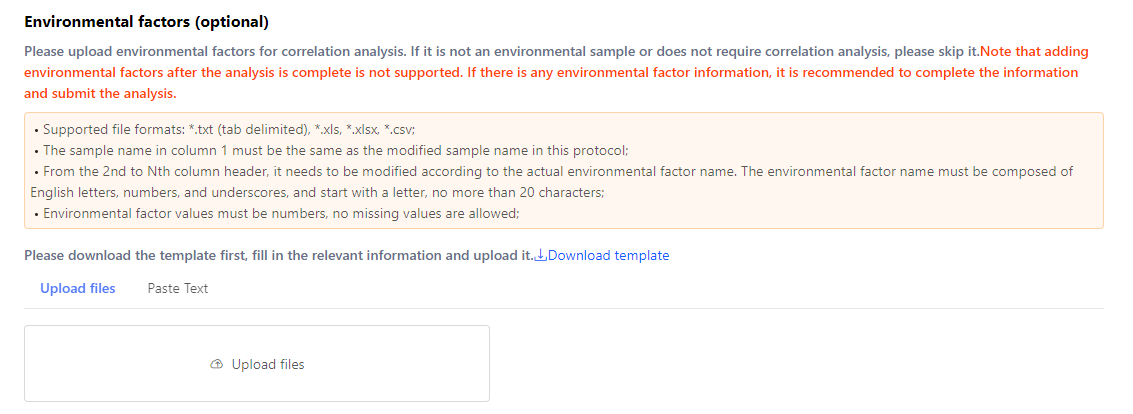
The LEfse and KEGG pathway analysis take longer times. You can untick them if you don’t need these analysis.
After finishing the whole plan, you can click previous step to check whether the information is all correct. If the plan is unfinished, you can click ‘Save’ to save this plan. The saved plan can be found in ‘My report’ tab after logging in to Dr. Tom.
Click ‘Submit Analysis’, the system will run the analysis. The analysis period depends on the sample amount.
Check results and custom analysis
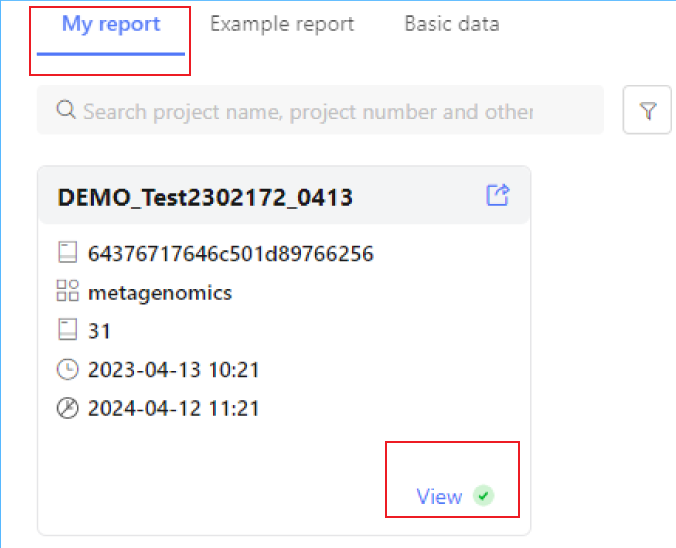
After you receive the email of the completion of the analysis, you can log in to the system with the account and password provided in the email, and find the analysis results in "My Report". The red dot in the upper right corner of the card page will indicate those reports that have been completed but not checked.
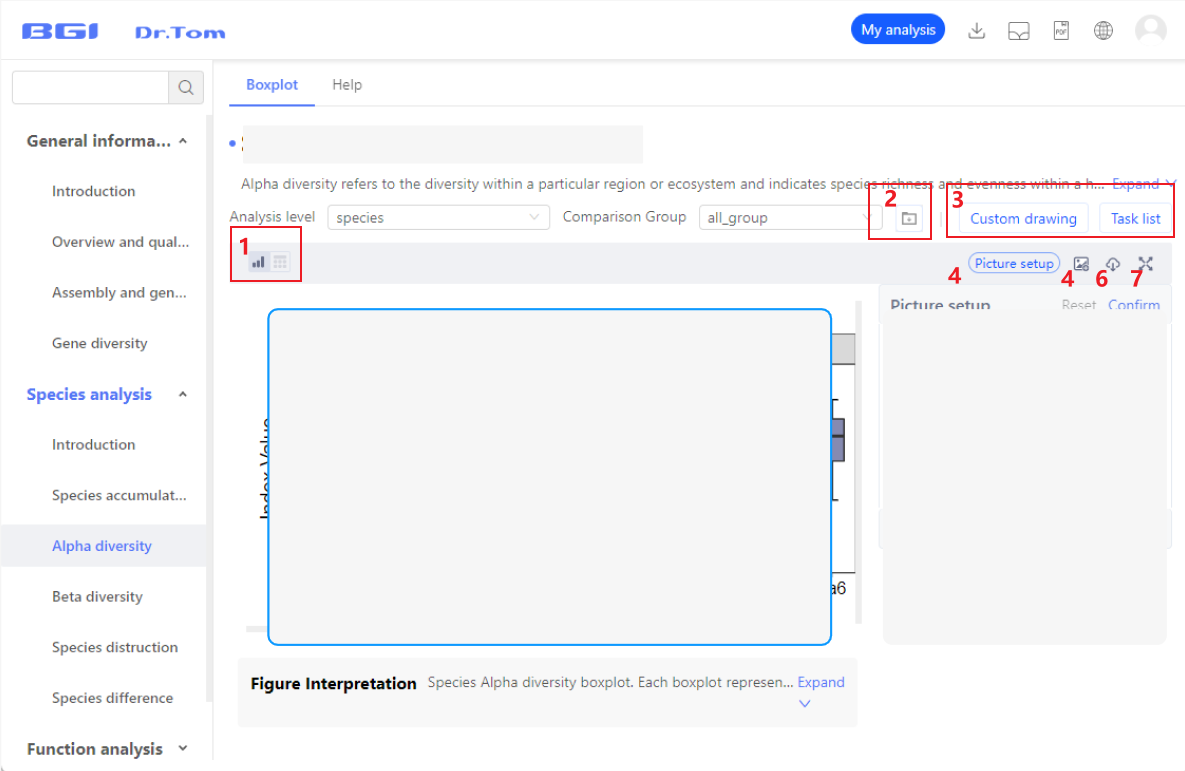
Result page layout
The resulting page consists of sidebar, top menu, and content area.
- Sidebar: Click on the sidebar to view analysis content and help.
- Top menu: Use the menu on the top result graph to adjust the different analysis/visualization methods.
- Content area: presents analysis/visualization results.
The page structure and content are described below:
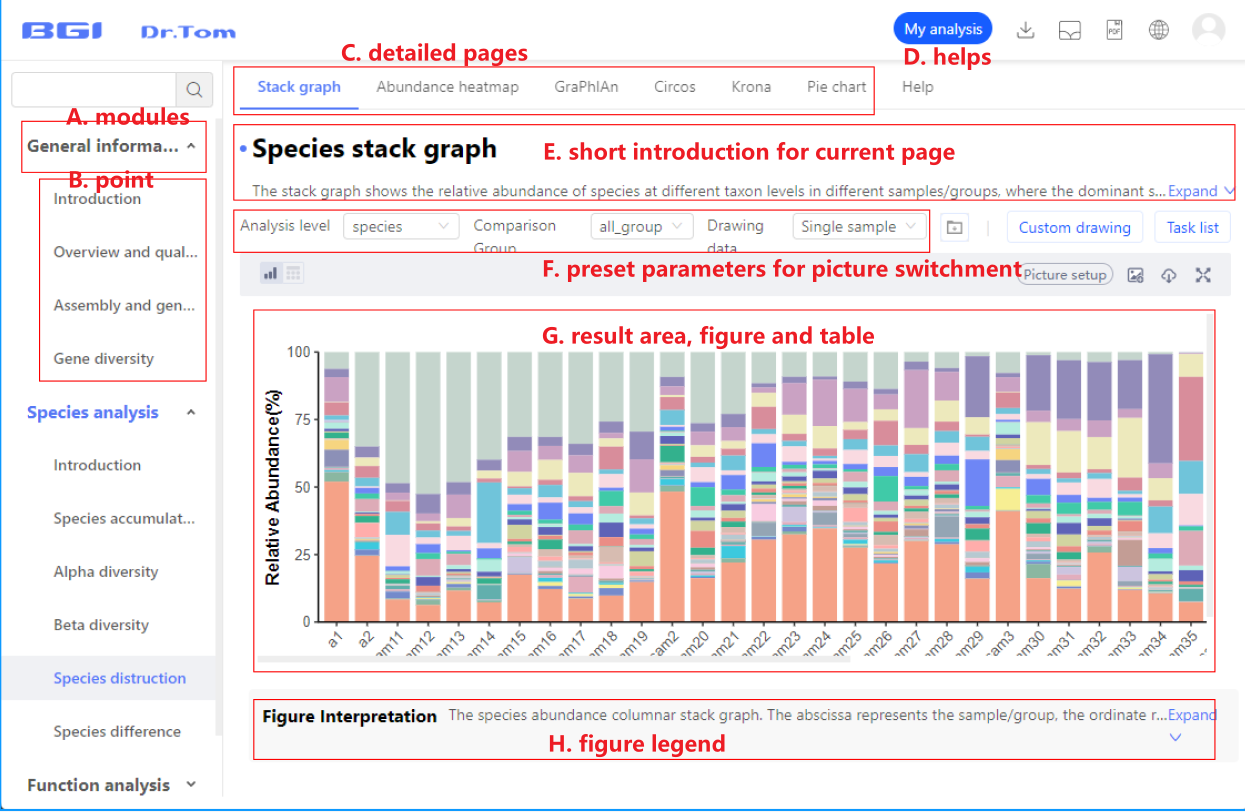
A. Analysis content: Dr.Tom provides gene analysis, species analysis and functional analysis, and each analysis content includes different analysis points.
B. Analysis points: Analysis points refer to the subdivision analysis under the analysis content. The division of analysis points will help you have a clearer understanding of the results that metagenomics can obtain.
C. Specific result page: An analysis point can use multiple analysis methods, or use different visualization schemes. Dr.Tom provides at least one analysis/visualization result for the data that meets the requirements, and the data that does not meet the analysis requirements will not be displayed.
D. Detailed description of analysis points: The content of the description includes a detailed introduction of the analysis method and some common problems. If you are not familiar with the analysis method, it is recommended to read this part first.
E. Brief description of analysis results: A brief introduction is provided for specific analysis/visualization results, through which you can understand the significance of the analysis.
F. analysis parameters: used to adjust the analysis results. After you fill in the analysis scheme, the system will analyze the process according to the parameters you set, and generate corresponding results/pictures. Through the combination of parameters above the picture, you can call up the corresponding analysis results.
G. Visual results Presentation: This section displays the results, including pictures, data tables, or analysis results tables.
H. Figure Description : This part introduces the elements of the picture and the interpretation of the results.
Key function button
On the results page, you can view image results, modify image parameters, and download analysis data.
- Figure and corresponding data. An analysis result usually corresponds to a figure and a data table, but there are some special cases:
- LEfSe analysis: Each result has two figures and one table.
- CCA/RDA analysis: 1 figure and 2 tables for each result.
- Network diagram: There are 1 figure and 2 tables.
- The Mantel test has only 1 table, and the custom drawing has 1 figure and 1 table.
- If there is intermediate data in the analysis, the button is blue, indicating that you can download relevant data; otherwise, the button is gray, indicating that no relevant data is downloaded.
- You can screen data and set analysis parameters here, and submit the analysis. Then, check the results in the task list and "My analysis".
- Modify the color, title, font size and other parameter here.
- If you are satisfied with results or perform comparision, add the pictures to the gallery and view them in "My Gallery".
- The system supports downloading images in PNG, JPG, SVG, and PDF formats
- Click this button to expand the picture display area and get a wide field of vision.
Picture set
You can adjust almost all graph results (except GraPhlAn, LEfSe and Linear Regression), including the presence or absence, size and color of elements in the picture.
Note
Your adjustment to the picture are limited to the current analysis results. If you want to keep the settings, click Apply parameters to switched graph.
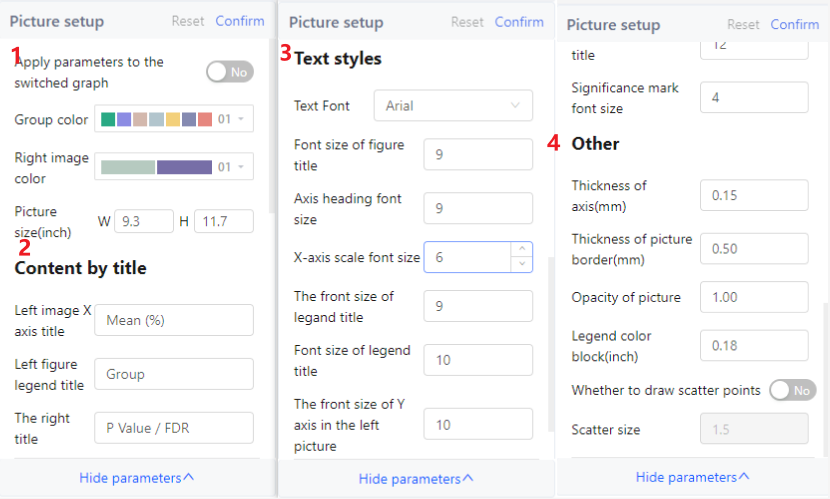 If you do not understand the parameter, hover the pointer over the parameter title to view the parameter description.
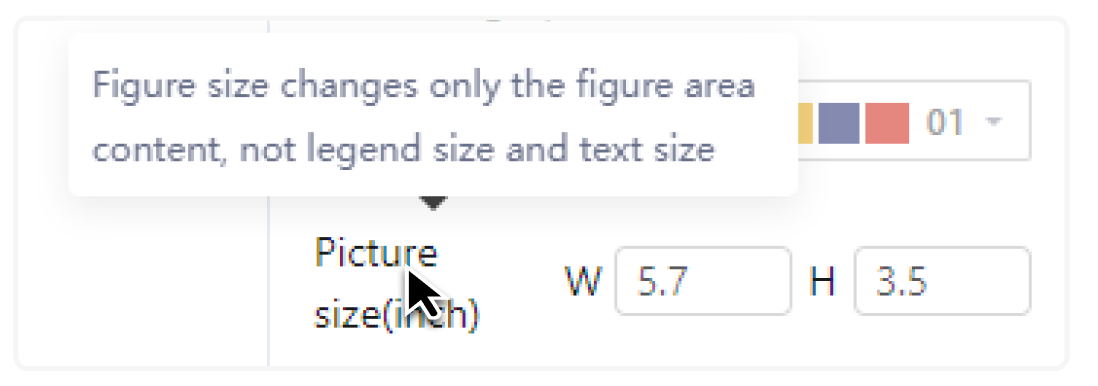
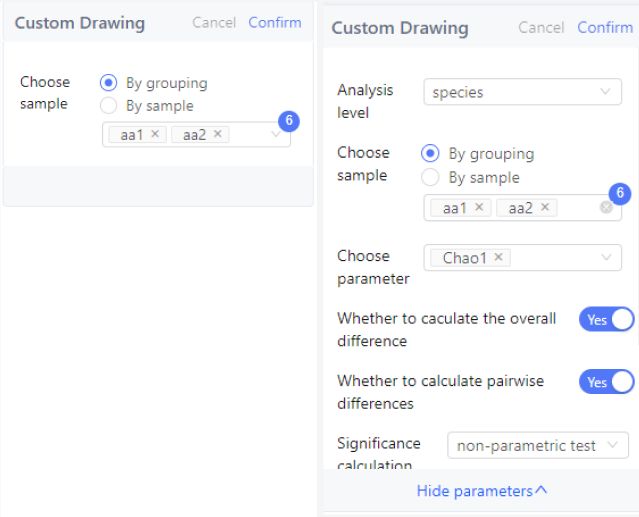
Custom drawing
"Image Settings" simply change the style and presentation of the image. The "Custom drawing" will filter and calculate the data according to the user's settings, and re-plot.
According to the analysis method and input data type, the data processing includes species taxonomic level/functional database or annotation level selection, sample selection, species data screening, data normalization scheme selection, etc.
- Species classification level/function database or annotation level selection: Species and some functional databases are multi-level data, and most of the existing analysis methods can only target one level, so it is necessary to specify the data level for analysis. For example, species analysis can choose kingdom, phylum, class, order, family, genus, and species.
- Sample selection: Custom analysis can select a specified sample to re-analyze according to requirements. For example, if you find an abnormal sample in the results and want to remove the abnormal sample and re-analyze, you can uncheck the sample when selecting samples for custom analysis.
- Species/Functional Screening : There are two Settings in the system for species screening, which are 'species/function screening' and 'classify to others'. The difference is that' species/function screening 'only selects eligible data for display. 'Classify to others' will display the unqualified data in a' others' category.
- Data normalization scheme: Data normalization solves the problem of data scale and data measurement. For example, when the data differences between samples are too large to be displayed in one graph, or when different environmental factors are measured differently and cannot be compared, data normalization processing can be performed.
Other system functions
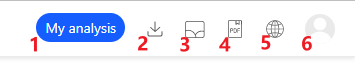
1. My analysis
The "My Analysis" page records all the custom drawings that have been submitted or favorited. Click on a specific item to enter the corresponding analysis results, and you can also perform certain customizations on the results page.
2. Data package download
Here you can download all the results for the entire analysis and the complete species abundance table, excluding the abundance table information for functions and genes. Complete gene abundance, species abundance, and functional abundance are delivered with Clean Clean.
3. My Gallery
On the resulting page, the image set to "Add to Gallery" can be found here.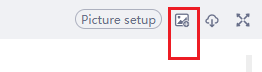
4. Export PDF
The system summarizes the main results (but not all results) into a PDF. If you need complete results, please log in to the system to view.
5. Switch language
The system provides two languages: Simplified Chinese and English.
5. Personal center
You can logout here.
Other matters
- Due to the large size of some result pictures, please use this system on a screen of 14 inches or above for a better experience.
- If you have any questions about the analysis method and the meaning of the results, please use
Ctrl+Fto search for the interpretation of analysis or results in the corresponding Analysis Help/System Help. - Frequently Asked Questions: Click here to view