Basic Functions
Search
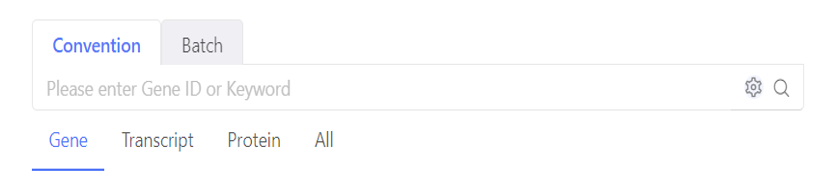
Search box on the homepage helps us to quickly locate the target genes/transcripts/proteins/DMRs/cells in the home table. In Convention mode, you can input one or more keywords (divided by space). Click the set button, you can set the logic and search scope. In Batch mode, you can search for more than IDs or symbols.
Data upload
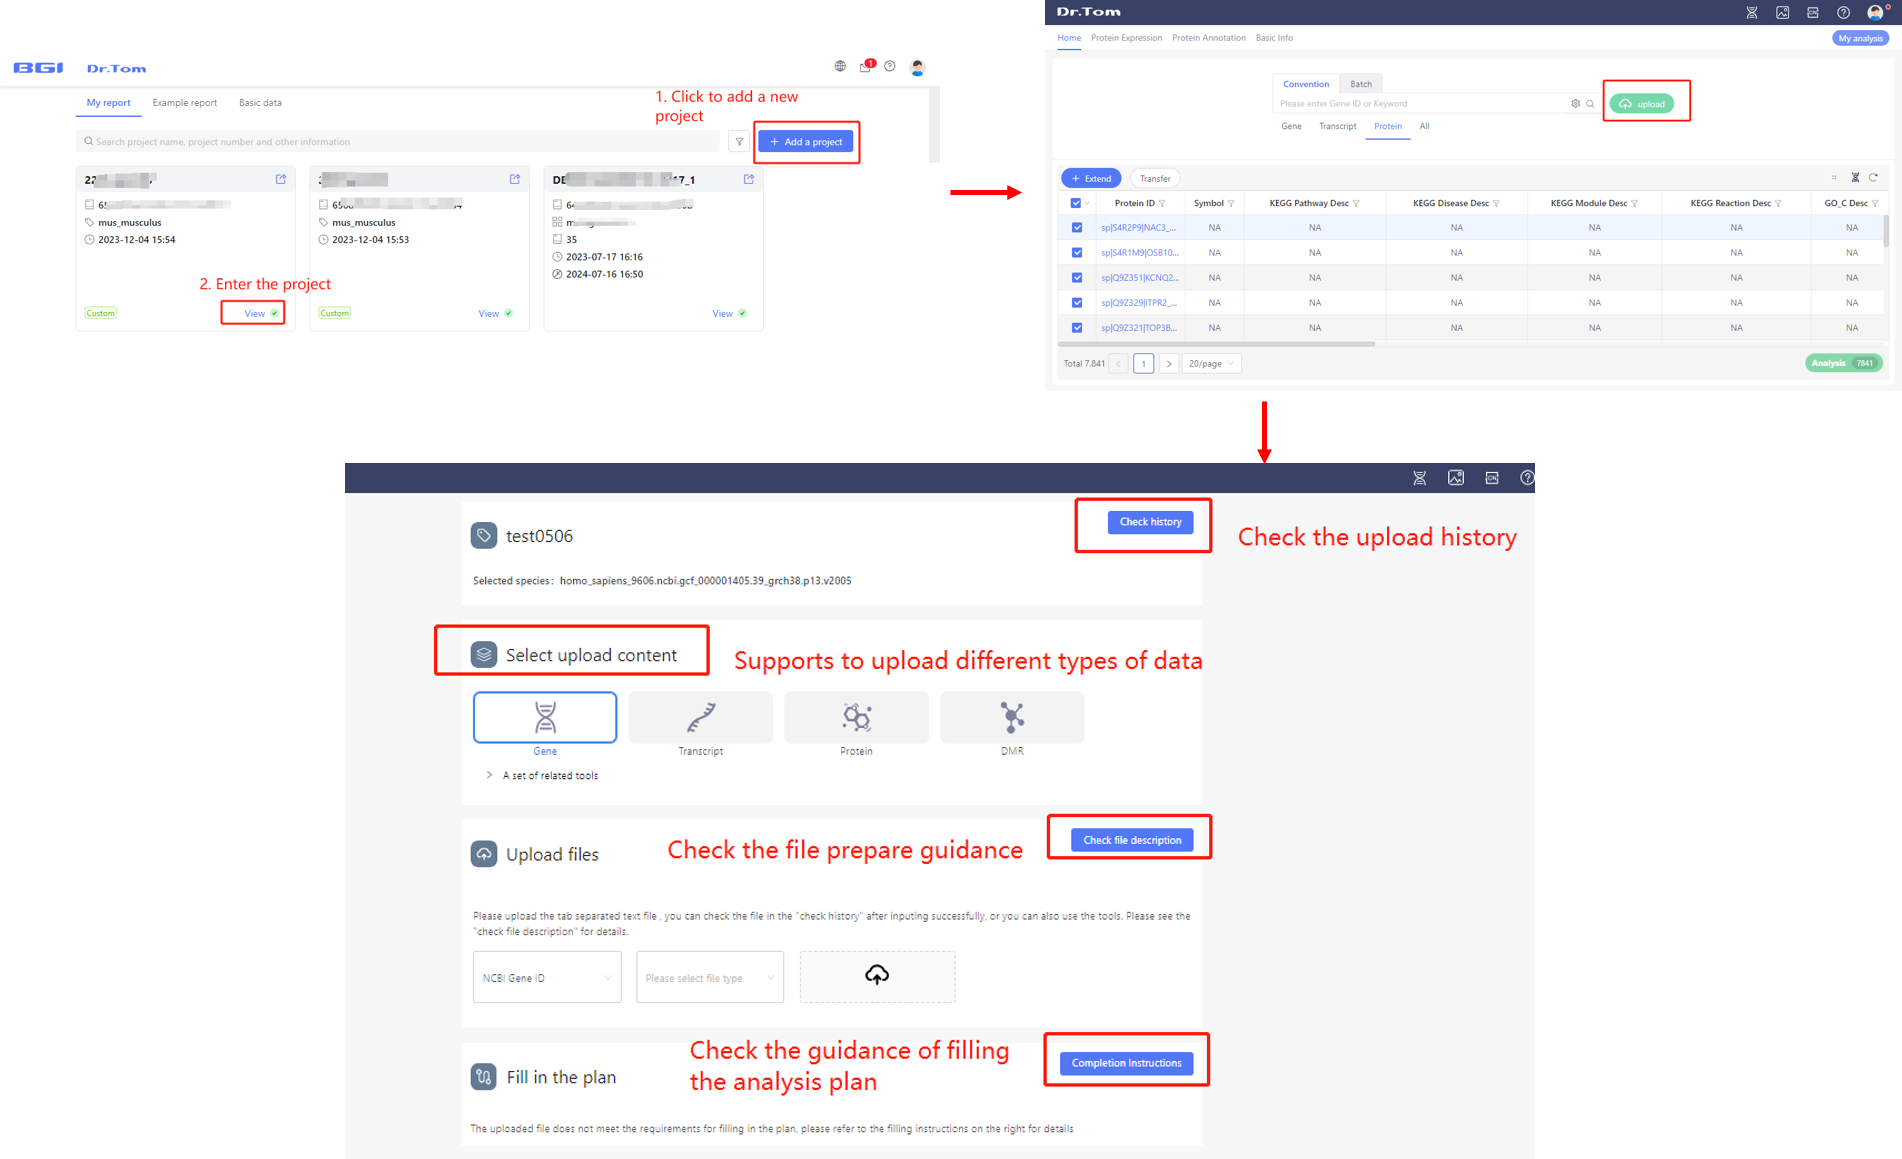
Dr. Tom system supports to upload your own data. Click the ‘Add a project’ button after login, or the ‘upload’ button in the homepage of a project, to upload the data. Please read the file prepare guidance carefully and prepare files as required, and upload the data. If it is a new project, you are allowed to fill the analysis plan after you upload read count data successfully. Notice that you can only submit one analysis plan in one project.
Expression Data Upload Procedure
Expression file format requirement
Gene detail
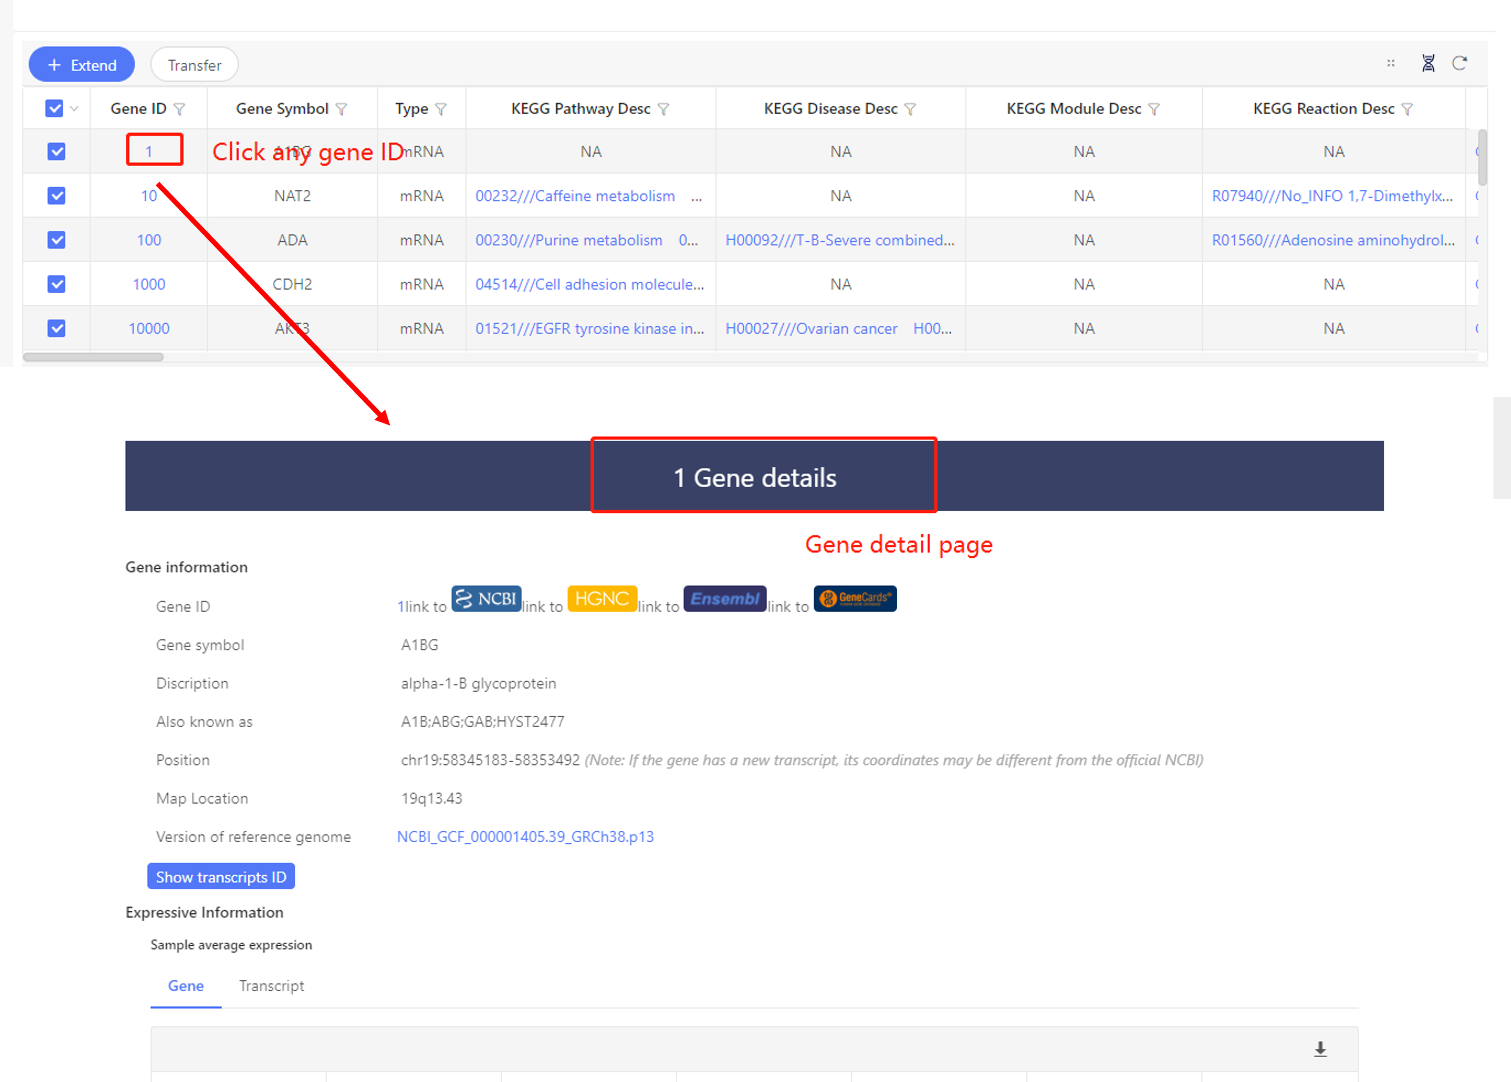
Click gene ID in any table, it’ll be linked to the gene detail page, which contains the gene expression information, annotations in different databases, links to external databases, etc. Besides, Dr. Tom offers publications that have studied the corresponding genes for your reference.
Table extension
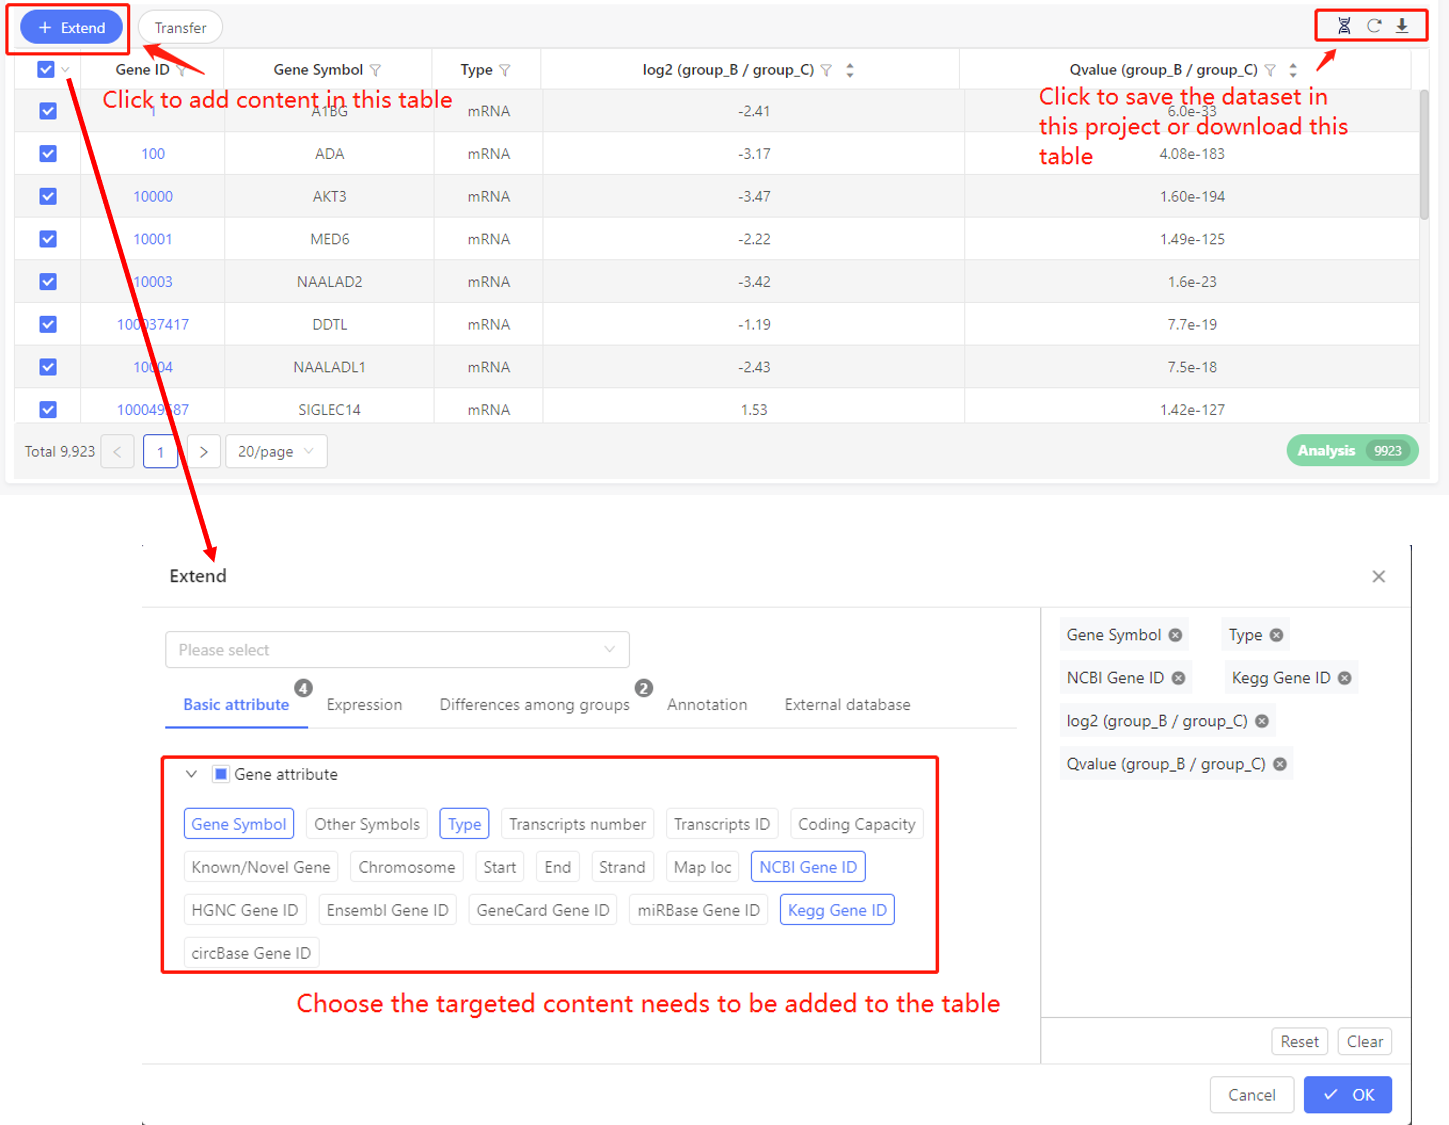
In the upper left of every table, there is an ‘Extend’ button. Click it, you can choose to add basic attribute, expression, differences among groups, annotations and information from external database to the table. Select the corresponding tag, click OK, the table will be updated.
Transfer
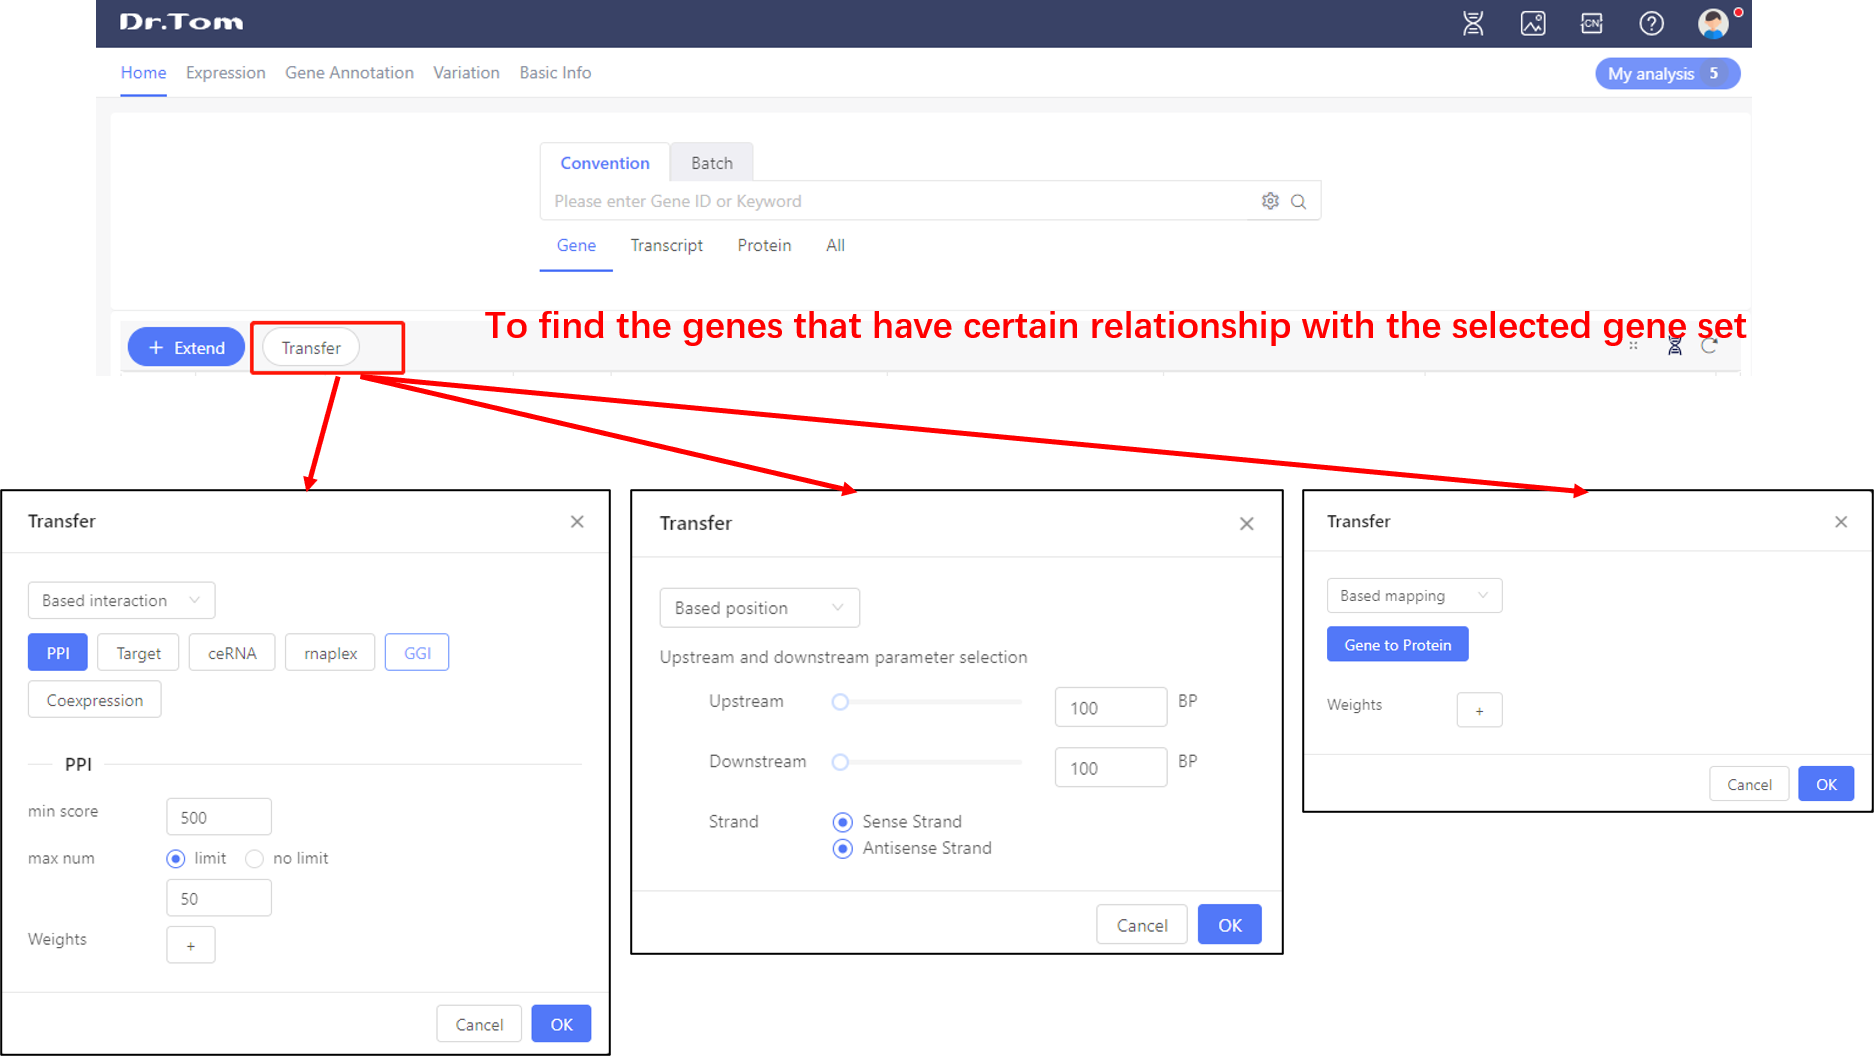 Click the ‘Transfer’ button on the upper left of the tables, we can find the genes that have PPI/Target/ceRNA/rnaplex/GGI/position/mapping relationship with the selected gene set.
Interactions between graphs and tables
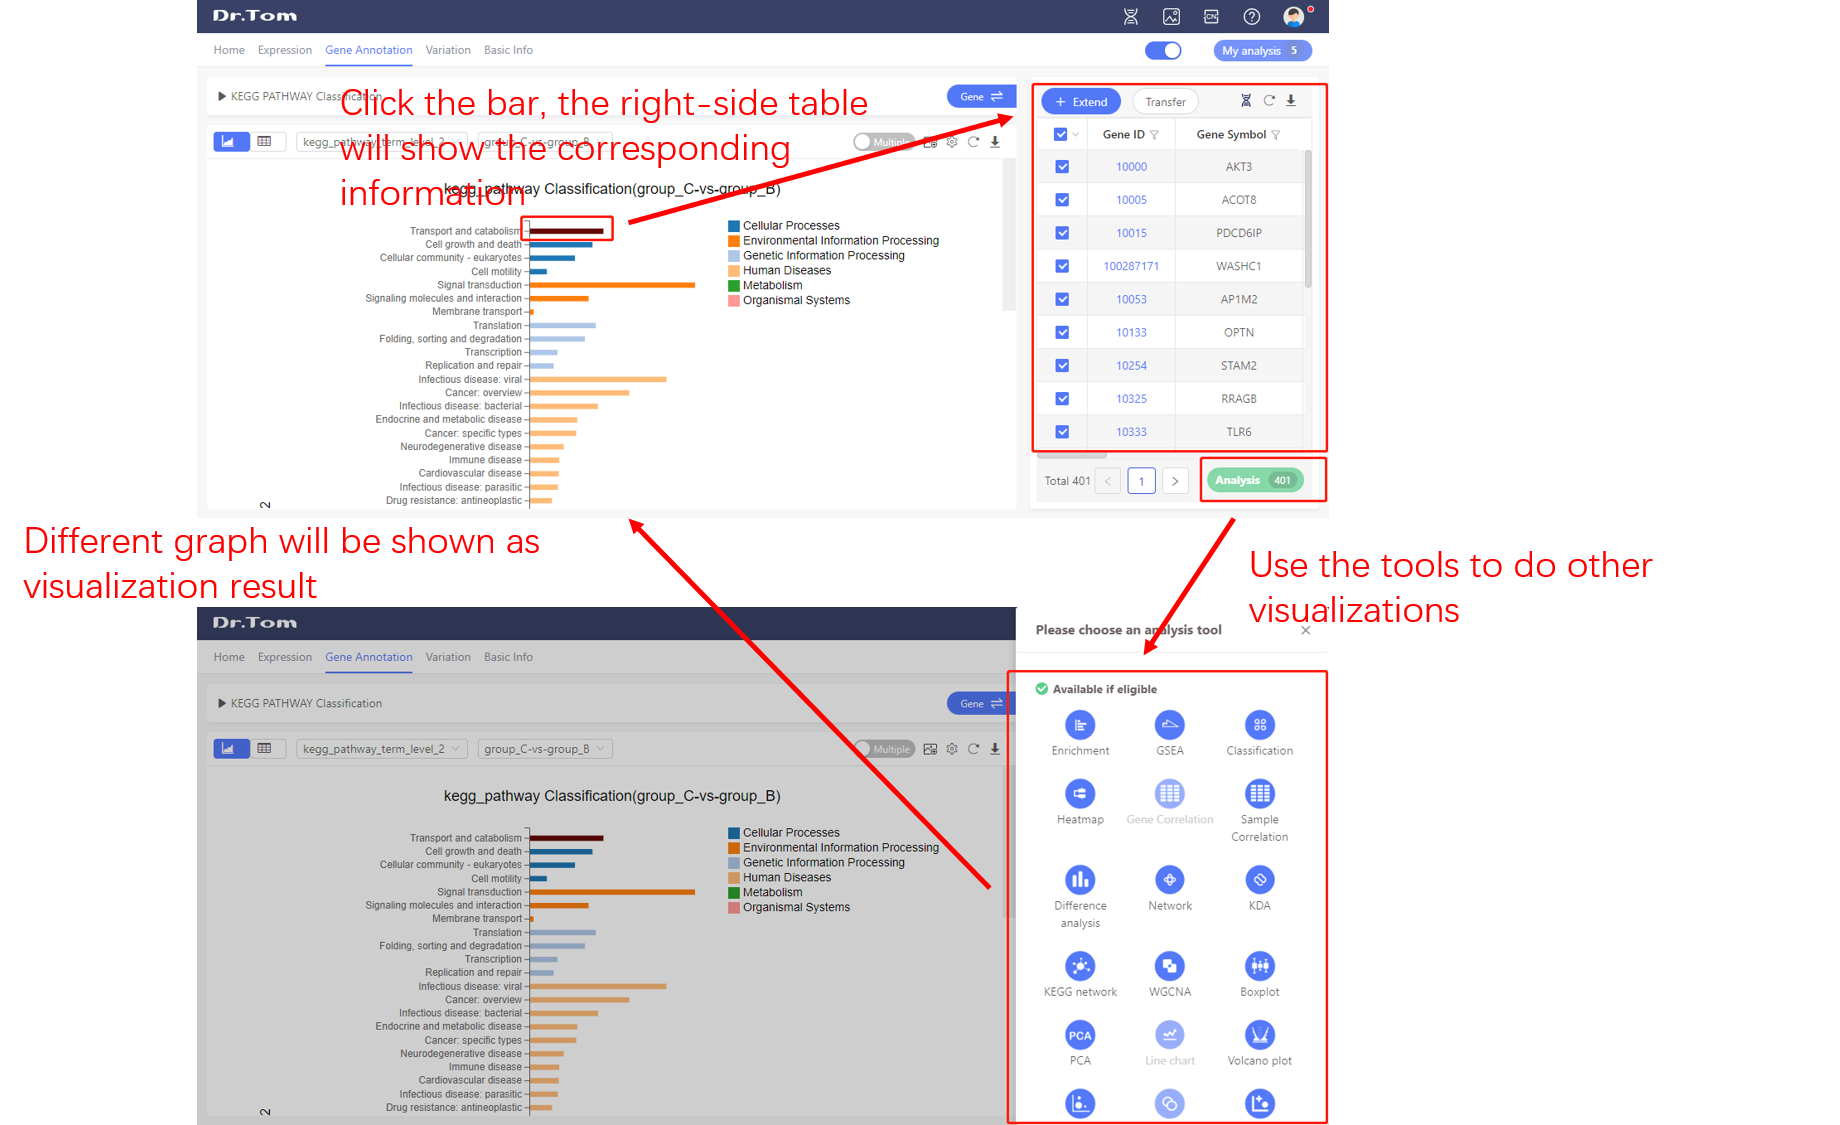
Most of the graphs in Dr. Tom system is interactive. Select the targeted part in the graph by clicking, the right-side table will show the corresponding information. Open the tool box, we can use other analysis tools to do data visualization. The circulation of ‘graph-table-graph’ helps us to do infinite data mining.
My analysis
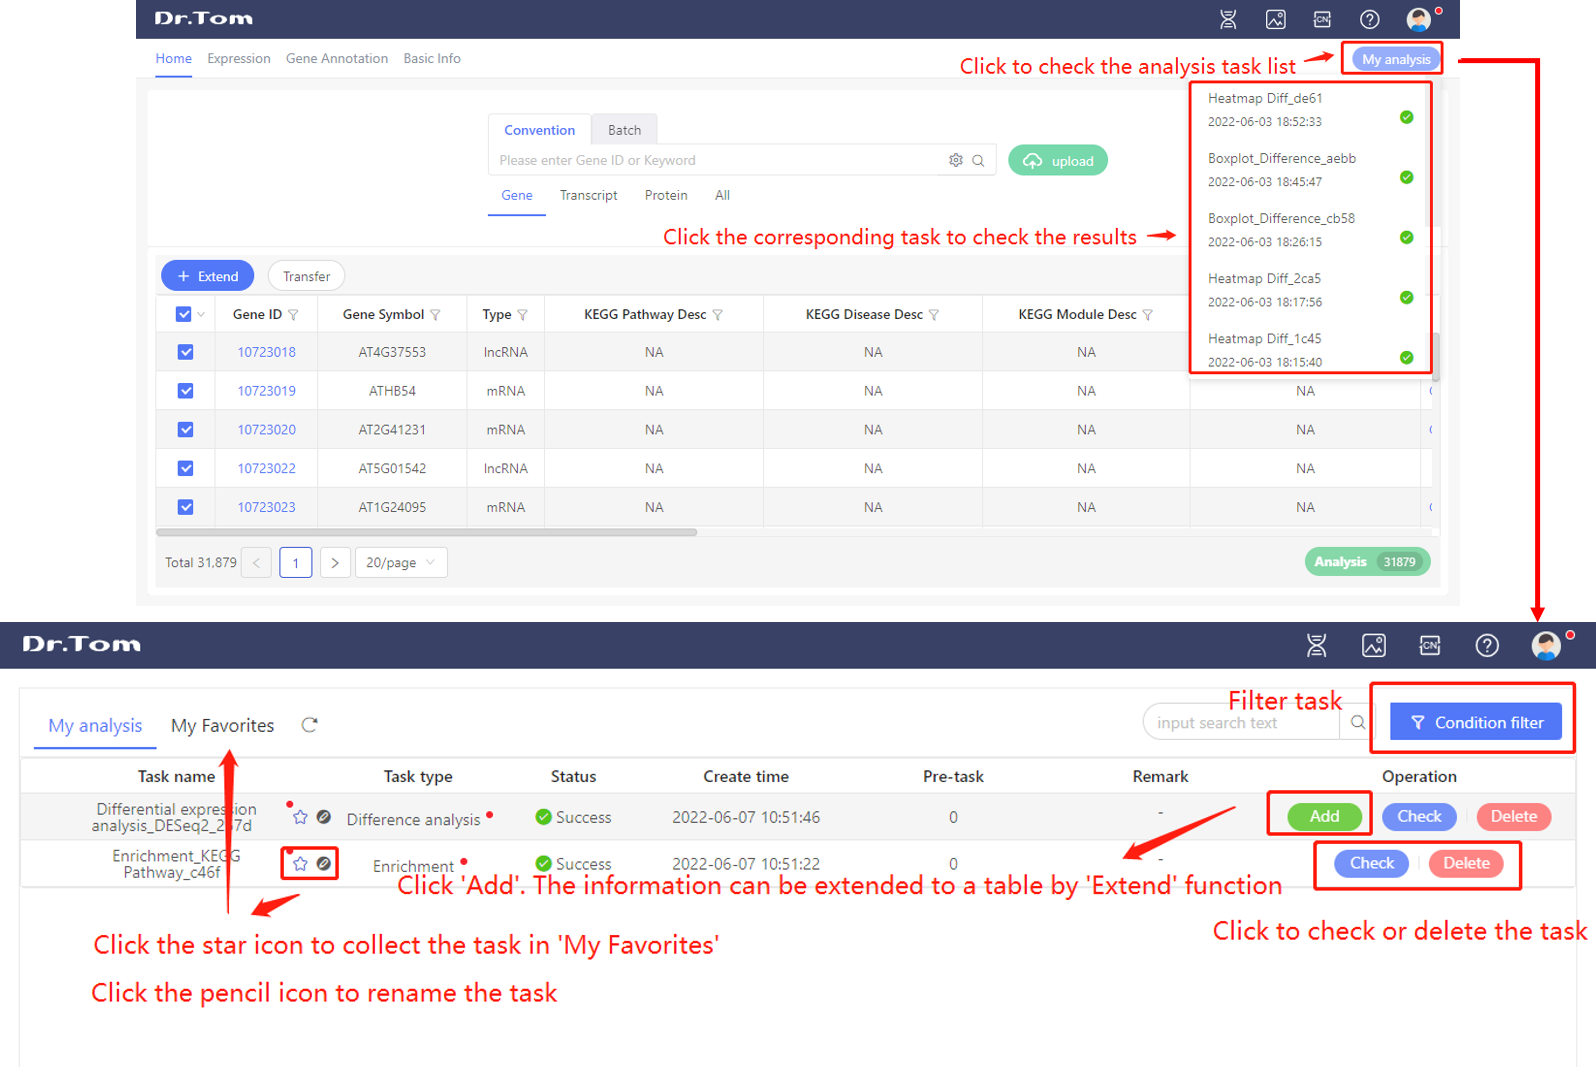 After we submit an analysis task using analysis tools, the task will be shown in the ‘My analysis’ list. Click my analysis, we can check all the tasks and the status. We can rename, collect, delete or check every task.
Graph setting and download
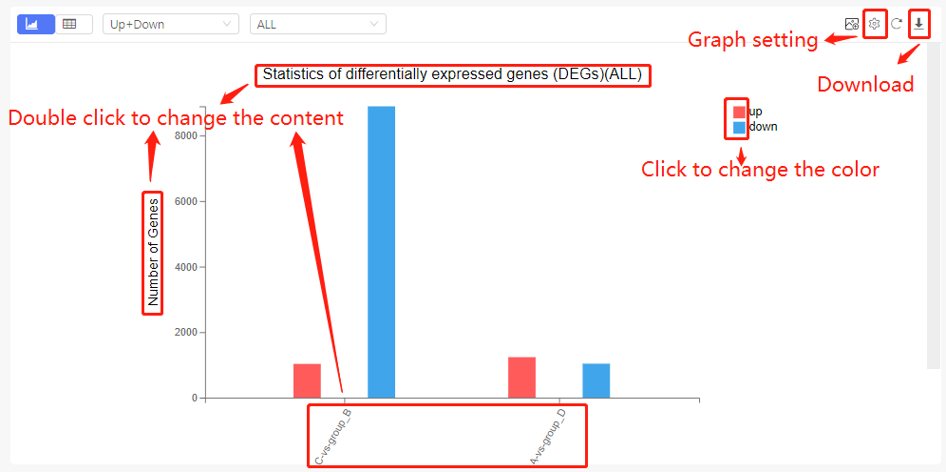
Most of the graph in Dr. Tom system can be edited. Double click the title/axis title to change the name. Click the legend to change the color. Different graphs have different setting parameter, which can be checked by clicking the setting button on the upper right of the graph. Graphs can be downloaded in JPG/PNG/SVG/PDF format.
Dataset saving
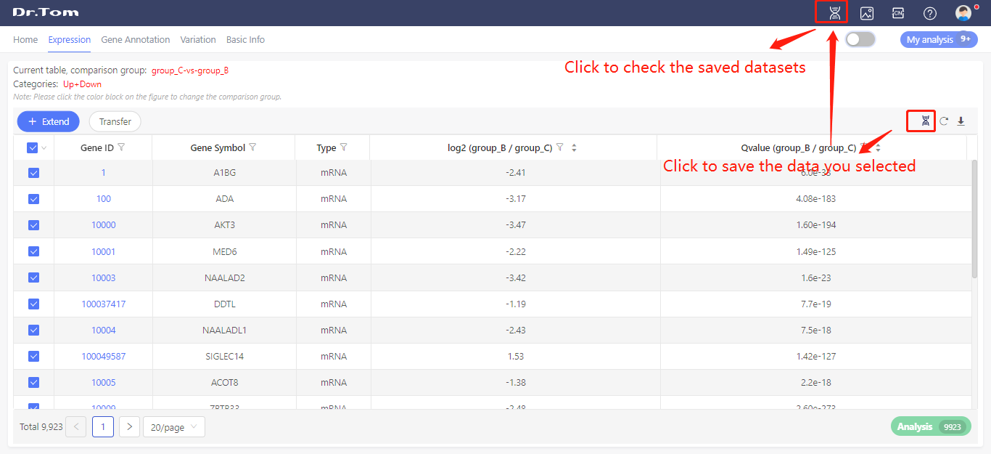
Tick to select the data, click the save button on the upper right of the table to save the dataset in this project. Click ‘My dataset’ to check saved dataset.
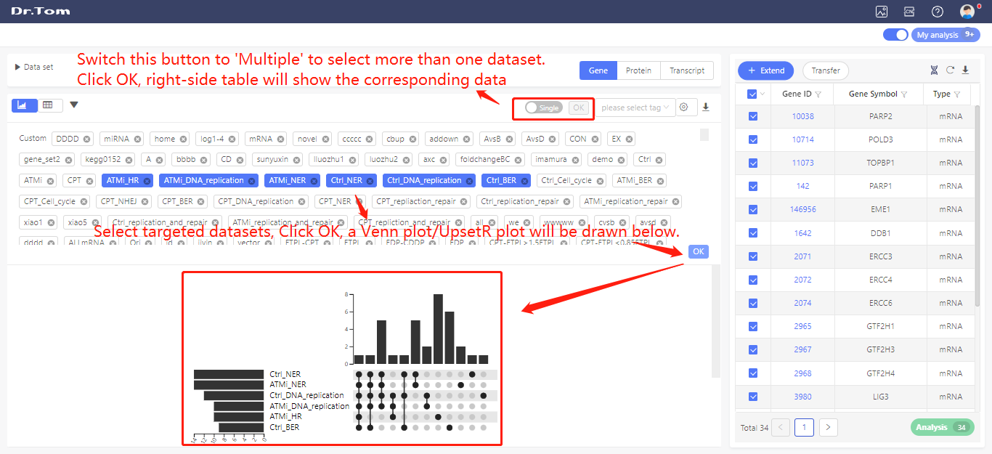
In ‘My dataset’, all the saved datasets can be checked. Select targeted datasets, right-side table will show the corresponding data and a Venn plot/UpsetR plot will be plotted.
Export expression file
When the analysis report is generated, users can export expression data from Dr. Tom.
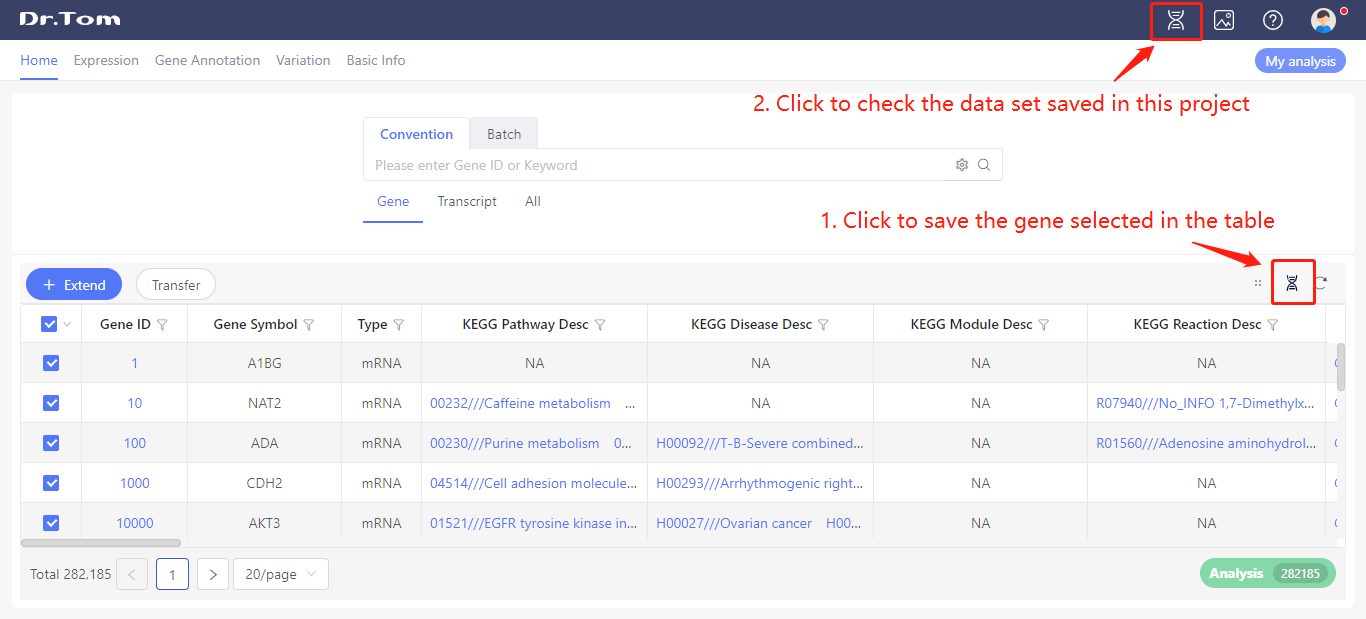 Click ‘Save ID’ button on the home page to save the gene set. Then, click ‘My data set’ to check the data set list.
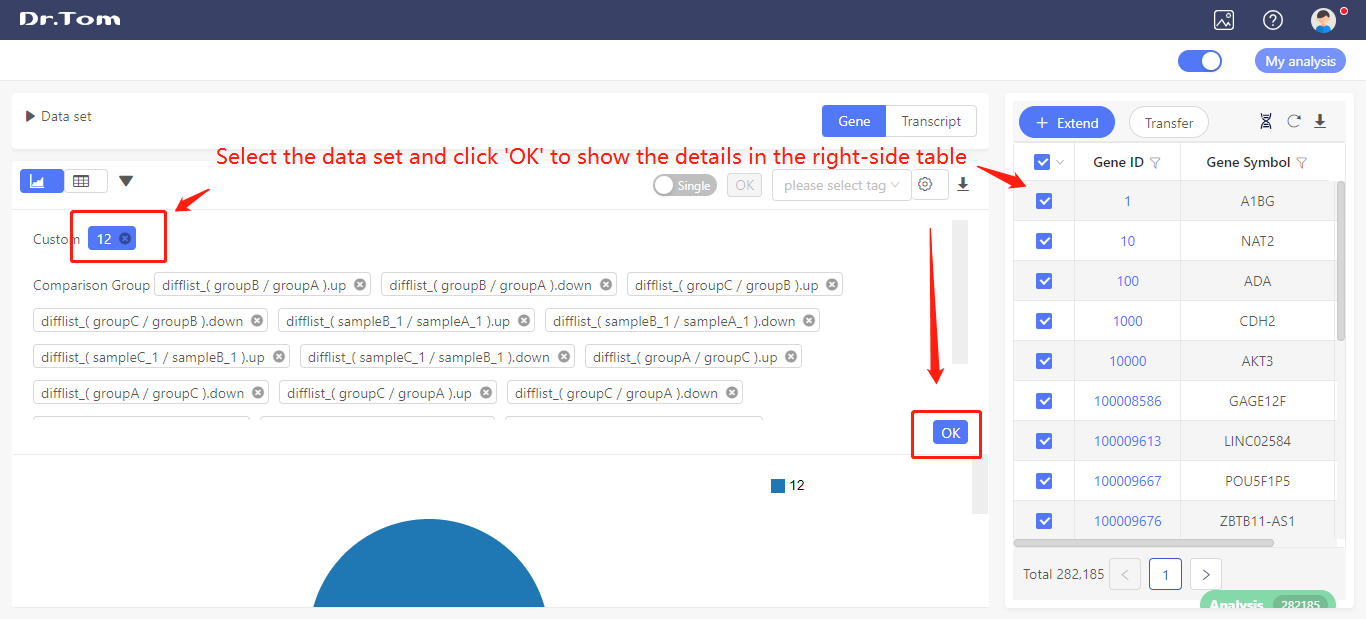 Select the data set you just saved, and click ‘OK’. The right-side table will show the gene details.
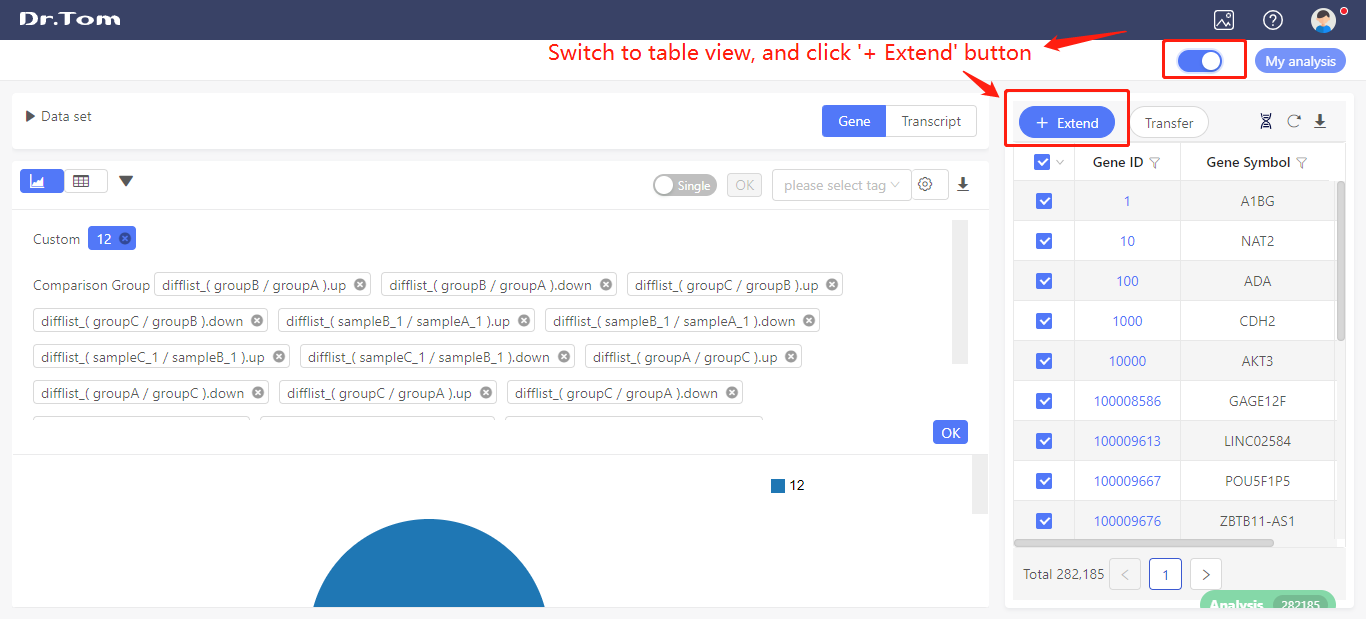
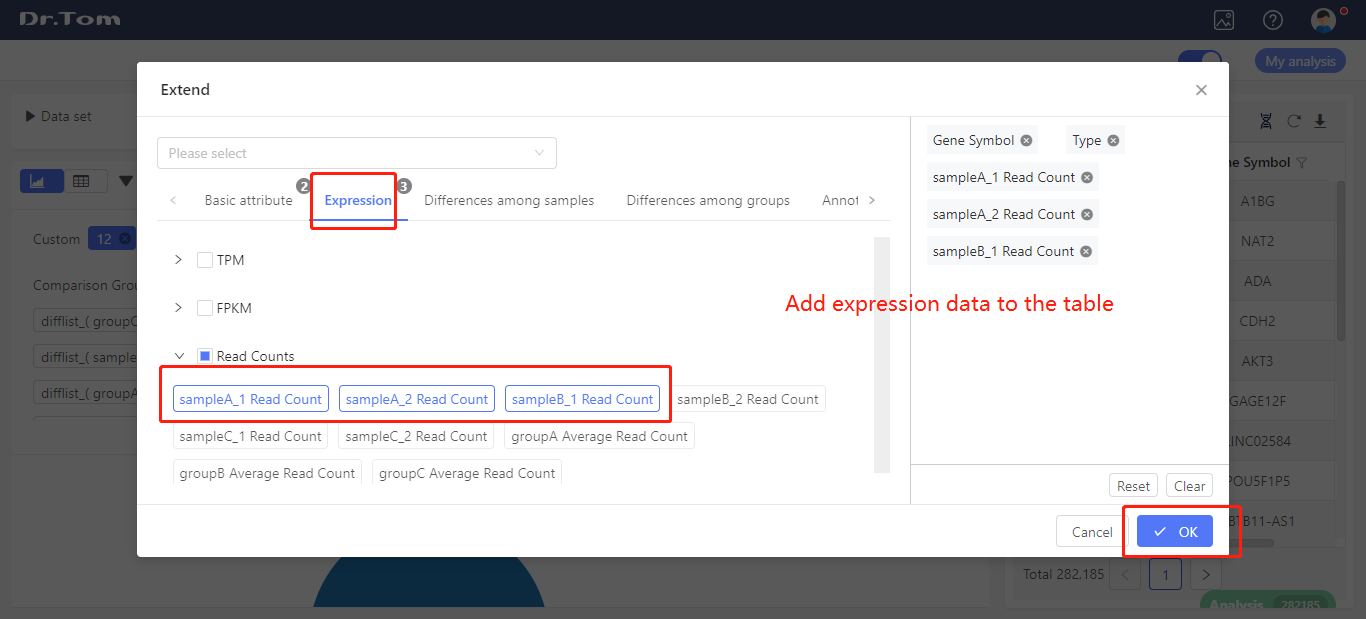 Switch to table view, and click ‘+ Extend’. Select the expression data (read count, FPKM or TPM) you want to exported. Click ‘OK’, the table will be extended.
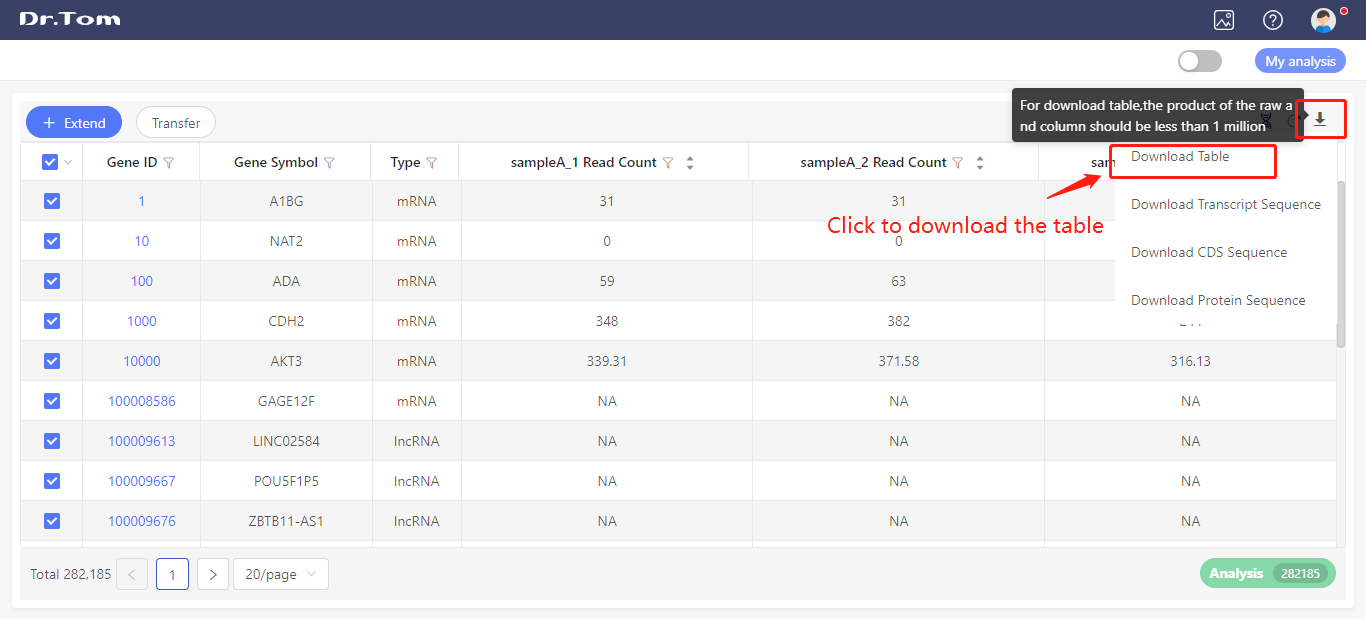 Hover on the ‘Download’ button, and click the ‘Download table’ button to export the expression data.
Be aware that Dr. Tom only allows downloading tables with a row-column product less than one million. If the table contains too much content, it can be downloaded in batches.