Species annotation
Introduction
When exploring the composition of microorganisms in the sample, compare each read in the clean data to the database to obtain the species information corresponding to the read, and all the read annotation results constitute the composition information of the community, and then construct the species abundance through the algorithm to obtain species abundance.
Species Annotation
Kraken2 [1][2] is a species annotation software based on k-mer. Compared with traditional sequence (or gene) alignment methods, Kraken2 has the advantages of faster speed and more sensitivity to base differences. The principle is as follows:
Mer is a monomeric unit, and a mer can be regarded as a base. k-mer refers to a nucleotide sequence containing k bases. Kraken2 will first build a sub-database from one or more sources of annotation databases as required, and split the genome sequences of all possible species into k-mer and store them. For any unknown sequence of length n that needs to be aligned, it is first split into n - k +1 k-mer , and then these k-mer will be aligned to the sub-database one by one. All k-mer that hit the database will be placed on a classification tree, and the missing k-mer will be ignored. The nodes on the classification tree record the number of k-mer hit. According to the lowest common ancestor (LCA) algorithm, selection analysis obtains the consecutive lowest common ancestor in the classification tree.
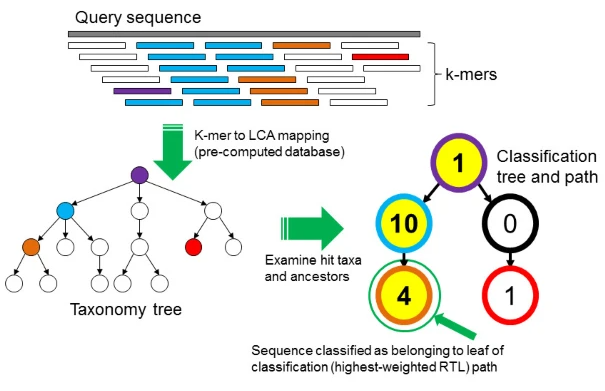
Plot 1: Principle of Kraken2
Step 1, Splice the sequence to be predicted into k-mer, small fragments in the figure
Step2, According to the LCA algorithm, all k-mers are placed on the nodes of the classification tree, and the number of each node represents the number of k-mers hitting the node. The hit nodes on the classification tree can be connected to form different paths; Step 3, Count the sum of the number of hit k-mers on each path, which is called the score;
Step 4, The classification of the path with the highest score is the species annotation result of the sequence. If the two longest paths have the same score, use the LCA algorithm to get their lowest common ancestor.
Kraken2 needsdatabases for species annotation. Dr. Tom provides two annotation databases, and automatically selects the appropriate database according to the sample source:
| Database | Construction method | Version |
|---|---|---|
| UHGG [3] | Public Kraken2 database | v2.0 |
| NCBI NT [4] | Official Kraken2 prebuit sub-library | k2_pluspf_16gb_20240112 |
Select the appropriate database according to the sample source:
Human intesinal samples:UseUnified Human Gastrointestinal Genome (UHGG) database. The database contains more than 200,000 human gut microbial genomes.
Other samples:Use sub-database built according to NCBI NT database. The NCBI NT database collects genome, gene, transcription sequence and other data from GeneBank, RefSeq, TPA and PDB databases, which can be used for bioinformatics data mining. However, because the data is too large, a sub-library will be constructed for species annotation.
| Software | Version | Commanders |
|---|---|---|
| Kraken2 [1:1] | 2.1.2 | kraken2 --paired --use-names --gzip-compressed |
Bracken Species Abundance Determination
Kraken2 classifies and annotates each read, but not every read can be annotated to the species level, and some reads can only be annotated to the genus or even higher level. If you simply add and count species abundance based on the results of reads and species annotations, the results will be inaccurate. Based on Bayesian theorem, Bracken2 [5] (Bayesian Reestimation of Abundance after Classification with KrakEN) assigns (re-assign) higher-level classifications that cannot be annotated to low-level in Kraken annotation results to low-level in the form of probabilistic estimate; for subspecies-level classification, Bracken2 directly add it up to the species level.
Through the calculation method described above, Bracken achieves accurate abundance. The abundance table will be used for subsequent statistical analysis.
| Software | Version | Commanders |
|---|---|---|
| Bracken2 [5:1] | 2.6.1 | bracken -r 150 -l S Note:r represents read length, it may be 100 or 150 |
Info
Speicies abundance tables can be fetched in two location.
- Clean data, where sample names in these tables are the sample names when you delivery the sample or reconfirmed names when client manager required you to provide. File path(es) are
- TaxonomyAnalysis/Abundance/{Classification level}.relative.xls:relative abundance of the specified taxonomic level
- TaxonomyAnalysis/Abundance/{Classification level}.absolute.xls:absolute abundance of the specified taxonomic level
- On the top right of report webpage, you can download report data which include taxomony abundance table whose sample names are the name you set when sumbitting the analysis plan. File path(es) are
- TaxonomyAnalysis/Rename_Abundance/{Classification level}.relative.xls:relative abundance of the specified taxonomic level
- TaxonomyAnalysis/Rename_Abundance/{Classification level}.absolute.xls:relative abundance of the specified taxonomic level
FAQ
Q: How to download annotated species abundance data?
A: In the system, click the "Download analysis results" button at the top of the page, you can download all the analysis results and obtain complete species abundance data.
Path:TaxonomyAnalysis/Rename_Abundance:
- {Classification level}.absolute.xls is an absolute abundance table for the specified taxonomic level
- {Classification level}.relative.xls is the relative abundance table of the specified taxonomic level
- {Classification level}.{data type}.xls.header is temporary analyzing data. No need to worry about it.
Q: Why do some projects have more annotations and more species than others?
A: The number of species annotation results is related to the following:
- The complexity of the environment: the more complex the environment, the more annotated species, and vice versa. Environments such as soil and water are high-complexity environments, while intestinal (feces) samples are low-complexity environments.
- Number of samples: As the number of samples increases, unique species in the samples are detected, which will increase the overall number of species annotations.
- Sequencing depth: The more sequencing data, the more rare species in the sample can be annotated.
If only a few annotated species in the sequencing results, there may be the following reasons after excluding experiments (experimental contamination) and sequencing (data amount):
- Samples come from low-complexity environments with fewer species;
- The number of samples grouped is small and cannot cover most species;
- There are few researches on the species concerned, and there are few representative sequences and related information of the species in the database.
Q: What does NA mean in annotation results?
A: The species annotation of the metagenomic project uses Kraken2 software. The principle is to break the sequencing sequence into subsequences of length k (default k=35), called k-mer, and then compare the k-mer to the database . A k-mer that matches the database is assigned one to the taxonomic tree, and those that do not match are ignored. When all k-mers of a sequence are annotated, the species annotation result at the lowest level on the annotation tree is the species annotation result of this sequence. When all k-mers are annotated only to high levels, such as genus, family, class, then the lower levels of the sequence will be marked as NA.
Q: What is the basis for the selection of species annotation databases?
A: The system automatically selects the database for species annotation according to the sample type. The UHGG data is used for the sample from the human gut, and the NCBI NT database is used for other sources.
Reference
Wood, D. E., & Salzberg, S. L. (2014). Kraken: Ultrafast Metagenomic Sequence Classification Using Exact Alignments. Genome Biology, 15(3), R46. https://doi.org/10.1186/gb-2014-15-3-r46 ↩︎ ↩︎
Wood, D. E., Lu, J., & Langmead, B. (2019). Improved Metagenomic Analysis with Kraken 2. Genome Biology, 20(1), 257. https://doi.org/10.1186/s13059-019-1891-0 ↩︎
Almeida, A., Nayfach, S., Boland, M., Strozzi, F., Beracochea, M., Shi, Z. J., Pollard, K. S., Sakharova, E., Parks, D. H., Hugenholtz, P., Segata, N., Kyrpides, N. C., & Finn, R. D. (2021). A Unified Catalog of 204,938 Reference Genomes from the Human Gut Microbiome. Nature Biotechnology, 39(1), 105–114. https://doi.org/10.1038/s41587-020-0603-3 ↩︎
Home—Nucleotide—NCBI. (n.d.). Retrieved May 6, 2022, from https://www.ncbi.nlm.nih.gov/nucleotide/ ↩︎
Lu, J., Breitwieser, F. P., Thielen, P., & Salzberg, S. L. (2017). Bracken: Estimating Species Abundance in Metagenomics Data. PeerJ Computer Science, 3, e104. https://doi.org/10.7717/peerj-cs.104 ↩︎ ↩︎